
Compare Globe Civil with Similar Stocks
Total Returns (Price + Dividend) 
Globe Civil for the last several years.
Risk Adjusted Returns v/s
Returns Beta

News
Are Globe Civil Projects Ltd latest results good or bad?
The latest financial results for Globe Civil Projects Ltd reveal a complex operational landscape characterized by strong revenue growth juxtaposed with declining profitability metrics. In the fourth quarter of FY26, the company achieved net sales of ₹143.18 crores, marking a significant sequential increase of 41.16% from the previous quarter. This growth reflects the company's ability to scale its operations effectively. However, the net profit for the same period was ₹5.76 crores, which represents an 11.66% sequential decline, indicating challenges in maintaining profitability despite the revenue surge. The operating margin for Q4 FY26 fell to 10.60%, down from 13.95% in the prior quarter, highlighting a compression of 335 basis points. This decline in margins suggests that the revenue growth has not translated into improved operational efficiency. Additionally, the profit after tax margin decreased to 4....
Read full news article
Globe Civil Projects Ltd is Rated Sell
Globe Civil Projects Ltd is rated 'Sell' by MarketsMOJO, with this rating last updated on 01 June 2026. However, the analysis and financial metrics discussed here reflect the stock's current position as of 02 June 2026, providing investors with the latest insights into the company’s performance and outlook.
Read full news article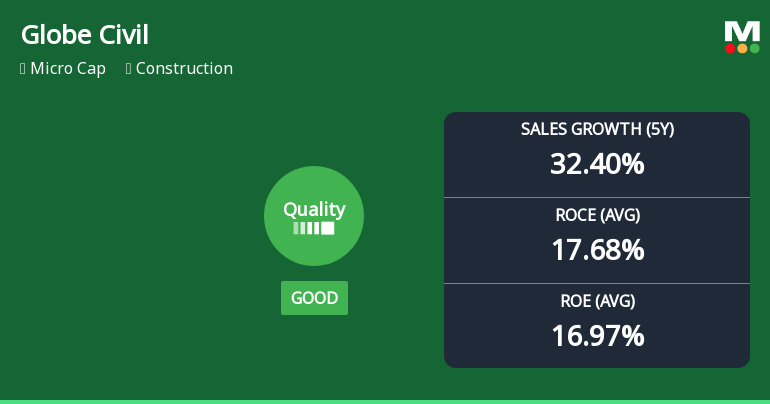
Globe Civil Projects Ltd Quality Grade Downgrade Highlights Fundamental Challenges
Globe Civil Projects Ltd has seen its quality grade downgraded from good to average, reflecting notable changes in its business fundamentals. Despite robust sales and EBIT growth over five years, concerns around debt levels and returns have weighed on investor sentiment, resulting in a Sell rating with a Mojo Score of 45.0. This article analyses the key financial metrics and market context behind this shift.
Read full news article Announcements
Announcement under Regulation 30 (LODR)-Press Release / Media Release
04-Jun-2026 | Source : BSEPress Release dated June 04 2026 with respect to the Audited Standalone and Consolidated Financial Results for the quarter and year ended on March 31 2026.
Corrigendum To Audited Financial Results For The Quarter And Year Ended 31 March 2026 - Correction Of Typographical Error.
02-Jun-2026 | Source : BSEWith reference to the Audited Standalone and Consolidated Financial Results of the Company for the FY ended March 31 2026 submitted with the Stock Exchange on May 30 2026. We wish to inform that in advertant typographical error has been noticed in the Consolidated Statement of Assets and Liabilities forming the part of the aforesaid Financial Results.
Announcement under Regulation 30 (LODR)-Newspaper Publication
01-Jun-2026 | Source : BSENewspaper Advertisements - Standalone and Consolidated Audited Financial Results for the quarter and year ended on March 31 2026
Corporate Actions

No Upcoming Board Meetings

No Dividend history available

No Splits history available

No Bonus history available

No Rights history available
Quality key factors
Valuation key factors
Technicals key factors
 Technical Indicator Scale: Bearish, Mildly Bearish, Sideways, Mildly Bullish, Bullish Turned
 Shareholding Snapshot : Mar 2026
Shareholding Compare (%holding)
Promoters
None
Held by 0 Schemes
Held by 4 FIIs (0.94%)
Nipun Khurana (26.87%)
Mukesh Chand Jain (2.82%)
24.74%
Quarterly Results Snapshot (Standalone) - Mar'26 - QoQ

QoQ Growth in quarter ended Mar 2026 is 40.11% vs 5.96% in Dec 2025

QoQ Growth in quarter ended Mar 2026 is -12.10% vs 9.20% in Dec 2025
Half Yearly Results Snapshot (Standalone) - Sep'25
Not Applicable: The company has declared_date for only one period
Not Applicable: The company has declared_date for only one period
Nine Monthly Results Snapshot (Standalone) - Dec'25
Not Applicable: The company has declared_date for only one period
Not Applicable: The company has declared_date for only one period
Annual Results Snapshot (Consolidated) - Mar'26
YoY Growth in year ended Mar 2026 is 7.17% vs 13.98% in Mar 2025
YoY Growth in year ended Mar 2026 is -3.12% vs 56.37% in Mar 2025
About Globe Civil Projects Ltd

Company Coordinates


