
Compare Globe Intl. Car. with Similar Stocks
Stock DNA
Transport Services
INR 189 Cr (Micro Cap)
19.00
39
0.00%
0.30
7.95%
1.93
Total Returns (Price + Dividend) 
Latest dividend: 0.05 per share ex-dividend date: Sep-22-2023
Risk Adjusted Returns v/s
Returns Beta

News
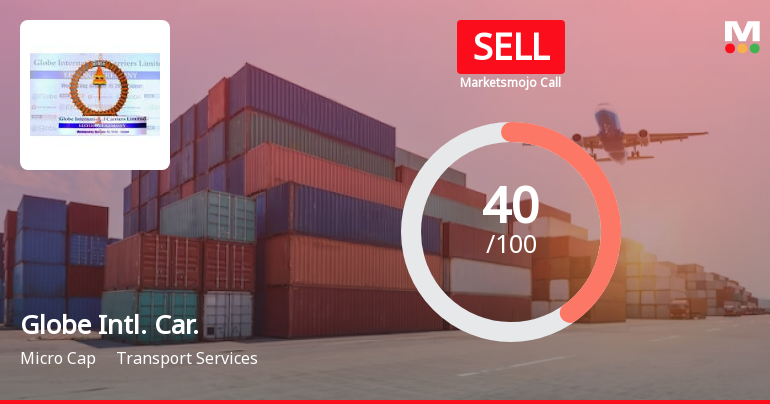
Globe International Carriers Ltd is Rated Sell
Globe International Carriers Ltd is rated Sell by MarketsMOJO, with this rating last updated on 21 May 2026. However, the analysis and financial metrics discussed here reflect the stock's current position as of 15 July 2026, providing investors with the latest insights into its performance and outlook.
Read full news article
Globe International Carriers Ltd Locks at Upper Circuit With 4.98% Gain — Buyers Queue, Sellers Absent
At Rs 18.96, the buying was done — not because demand dried up, but because the exchange wouldn't let the stock go any higher. Globe International Carriers Ltd locked at its upper circuit of 4.98% on 13 Jul 2026, with buyers queuing and no sellers willing to part with shares.
Read full news article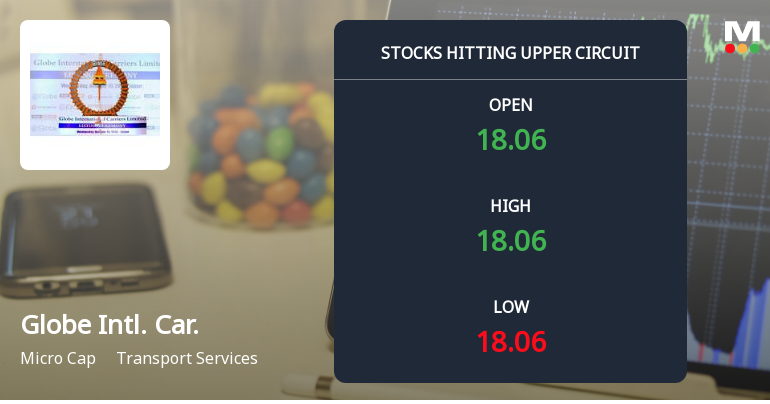
Globe International Carriers Ltd Locks at Upper Circuit With 5.0% Gain — Buyers Queue, Sellers Absent
At Rs 18.06, the buying was done — not because demand dried up, but because the exchange wouldn't let the stock go any higher. Globe International Carriers Ltd locked at its upper circuit of 5.0% on 10 Jul 2026, with buyers queuing and no sellers willing to part with shares.
Read full news article Announcements
Globe International Carriers Limited - Clarification - Financial Results
27-Nov-2019 | Source : NSEGlobe International Carriers Limitednal Carriers Limited for the quarter ended 30-Sep-2019 with respect to Regulation 33 of the SEBI (Listing Obligations and Disclosure Requirements) Regulations, 2015.
Globe International Carriers Limited - Outcome of Board Meeting
14-Nov-2019 | Source : NSEGlobe International Carriers Limitedal results for the half Year ended 30 September,2019 along with limited review report
Globe International Carriers Limited - Clarification
25-Oct-2019 | Source : NSEGlobe International Carriers Limited with respect to announcement dated 10-Oct-2019, regarding Resignation of Mr BALJINDER SHARMA as Independent Director of the company w.e.f. October 07, 2019.á On basis of above the Company is required to clarify following: 1.áA confirmation from independent director that there is no other material reason other than those provided in the resignation.á á áThe response of the Company is awaited.
Corporate Actions

No Upcoming Board Meetings

Globe International Carriers Ltd has declared 2% dividend, ex-date: 22 Sep 23

Globe International Carriers Ltd has announced 5:10 stock split, ex-date: 15 Oct 25

Globe International Carriers Ltd has announced 1:1 bonus issue, ex-date: 15 Oct 25

Globe International Carriers Ltd has announced 6:25 rights issue, ex-date: 22 Sep 23
Quality key factors
Valuation key factors
Technicals key factors
 Technical Indicator Scale: Bearish, Mildly Bearish, Sideways, Mildly Bullish, Bullish Turned
 Shareholding Snapshot : Mar 2026
Shareholding Compare (%holding)
Promoters
None
Held by 0 Schemes
Held by 1 FIIs (0.02%)
Shubhash Agrawal (37.58%)
Inventure Growth & Securities Limited (2.15%)
21.91%
Quarterly Results Snapshot (Standalone) - Mar'26 - YoY
Not Applicable: The company has declared_date for only one period
Not Applicable: The company has declared_date for only one period
Half Yearly Results Snapshot (Consolidated) - Sep'25

Growth in half year ended Sep 2025 is -15.58% vs 23.10% in Mar 2025
Growth in half year ended Sep 2025 is 2.02% vs 158.21% in Mar 2025
Nine Monthly Results Snapshot (Consolidated) - Dec'25

YoY Growth in nine months ended Dec 2025 is 10.83% vs -7.80% in Dec 2024
YoY Growth in nine months ended Dec 2025 is 175.26% vs -16.81% in Dec 2024
Annual Results Snapshot (Consolidated) - Mar'26
YoY Growth in year ended Mar 2026 is 11.66% vs 36.82% in Mar 2025
YoY Growth in year ended Mar 2026 is 105.21% vs 87.50% in Mar 2025
About Globe International Carriers Ltd

Company Coordinates


