
Compare GMM Pfaudler with Similar Stocks
Stock DNA
Industrial Manufacturing
INR 3,490 Cr (Small Cap)
29.00
37
0.26%
0.29
10.05%
2.88
Total Returns (Price + Dividend) 
Latest dividend: 0.9950863975104414 per share ex-dividend date: Nov-17-2025
Risk Adjusted Returns v/s
Returns Beta

News

GMM Pfaudler Ltd is Rated Sell
GMM Pfaudler Ltd is rated 'Sell' by MarketsMOJO, with this rating last updated on 21 May 2026. However, the analysis and financial metrics discussed here reflect the stock’s current position as of 01 July 2026, providing investors with an up-to-date view of the company’s fundamentals, returns, and technical outlook.
Read full news article
GMM Pfaudler Ltd is Rated Sell
GMM Pfaudler Ltd is rated 'Sell' by MarketsMOJO, with this rating last updated on 21 May 2026. However, the analysis and financial metrics discussed here reflect the stock's current position as of 20 June 2026, providing investors with the latest insights into its performance and outlook.
Read full news article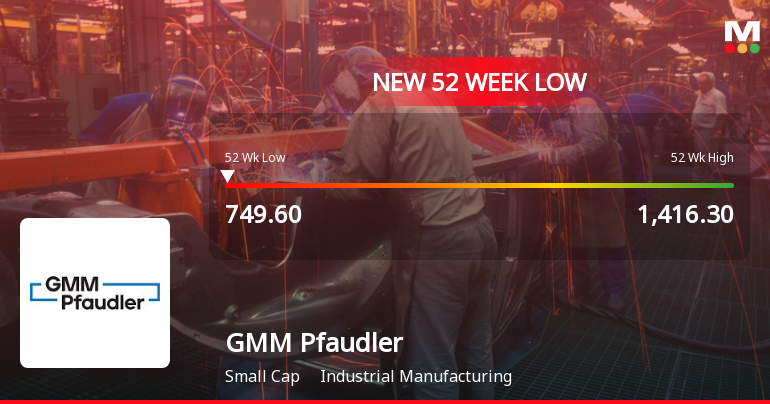
Announcements
GMM Pfaudler Limited - Analysts/Institutional Investor Meet/Con. Call Updates
15-Nov-2019 | Source : NSEGMM Pfaudler Limited has informed the Exchange regarding Analysts/Institutional Investor Meet/Con. Call Updates
GMM Pfaudler Limited - Updates
08-Nov-2019 | Source : NSEGMM Pfaudler Limited has informed the Exchange regarding 'Published Unaudited Financial Results for quarter ended September 30, 2019'.
GMM Pfaudler Limited - Analysts/Institutional Investor Meet/Con. Call Updates
30-Oct-2019 | Source : NSEGMM Pfaudler Limited has informed the Exchange regarding Analysts/Institutional Investor Meet/Con. Call Updates
Corporate Actions

No Upcoming Board Meetings

GMM Pfaudler Ltd has declared 50% dividend, ex-date: 17 Nov 25

GMM Pfaudler Ltd has announced 2:10 stock split, ex-date: 20 Oct 06

GMM Pfaudler Ltd has announced 2:1 bonus issue, ex-date: 11 Jul 22

No Rights history available
Quality key factors
Valuation key factors
Technicals key factors
 Technical Indicator Scale: Bearish, Mildly Bearish, Sideways, Mildly Bullish, Bullish Turned
 Shareholding Snapshot : Mar 2026
Shareholding Compare (%holding)
Non Institution
None
Held by 13 Schemes (15.78%)
Held by 113 FIIs (17.15%)
Millars Machinery Company Pvt Ltd. (9.7%)
Hdfc Small Cap Fund (9.66%)
25.02%
Quarterly Results Snapshot (Consolidated) - Mar'26 - YoY

YoY Growth in quarter ended Mar 2026 is 16.98% vs 8.89% in Mar 2025
YoY Growth in quarter ended Mar 2026 is 163.75% vs -197.54% in Mar 2025
Half Yearly Results Snapshot (Consolidated) - Sep'25
Growth in half year ended Sep 2025 is 6.68% vs -14.01% in Sep 2024
Growth in half year ended Sep 2025 is 23.66% vs -64.25% in Sep 2024
Nine Monthly Results Snapshot (Consolidated) - Dec'25
YoY Growth in nine months ended Dec 2025 is 7.87% vs -11.59% in Dec 2024

YoY Growth in nine months ended Dec 2025 is -49.73% vs -43.18% in Dec 2024
Annual Results Snapshot (Consolidated) - Mar'26
YoY Growth in year ended Mar 2026 is 10.17% vs -7.19% in Mar 2025
YoY Growth in year ended Mar 2026 is 9.14% vs -69.81% in Mar 2025
About GMM Pfaudler Ltd

Company Coordinates


