GMR Airports

  • Market Cap: Mid Cap
  • Industry: Transport Infrastructure
  • ISIN: INE776C01039
  • NSEID: GMRAIRPORT
  • BSEID: 532754
INR
98.03
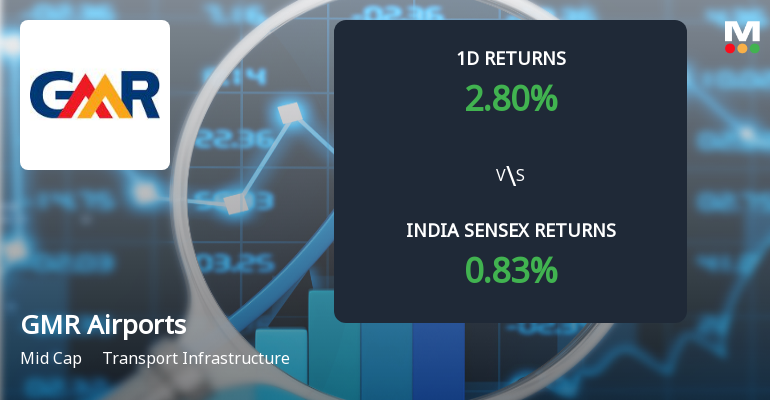
-0.45 (-0.46%)
BSENSE

Sep 22, 04:01 PM

BSE+NSE Vol: 84.54 lacs

  • Price Points
  • Score
  • Mojo Parameters
  • Total Return
  • News and Corporate Actions
  • Key factors
  • Shareholding
  • Financials
  • CompanyCV
stock-summaryPrice Point
High/Low

1Day

52 Week

Valuation
Technical
Day's Volume

CASH

84.54 lacs (-49.51%) Volume

Shareholding (Jun 2026)

FII

21.74%

Held by 716 FIIs

DII

5.14%

Held by 305 DIIs

Promoter

67.16%

Why is GMR Airports Ltd falling/rising?

06-Sep-2026

As of 05-Sep, GMR Airports Ltd's stock price is rising to 97.50, driven by strong financial results and increased promoter confidence, despite some risks related to negative book value and weak long-term fundamentals. The stock has outperformed its sector and generated a return of 12.69% over the past year.

As of 05-Sep, GMR Airports Ltd's stock price is rising, currently at 97.50, with a change of 0.89 (0.92%) upward. This increase can be attributed to several positive factors. The stock has outperformed its sector by 0.94% today and has experienced a consecutive gain over the last four days, resulting in a total return of 3.89% during this period. Furthermore, the company has reported very positive financial results, including a 23.76% growth in net sales and significant increases in profit before tax and profit after tax, with growth rates of 146.59% and 135.3%, respectively.<BR><BR>Additionally, promoter confidence appears to be rising, as they have increased their stake in the company by 0.83% over the previous quarter, now holding 67.16% of the company. This is generally viewed as a positive indicator of the company's future prospects. The stock has also generated a return of 12.69% over the past year, significantly outperforming the broader market, which has seen returns of only 1.51%.<BR><BR>However, it is important to note that there are some negative aspects, such as the company's negative book value of Rs 2,479.76 crore and a weak long-term fundamental strength, which could pose risks. Despite these concerns, the current upward movement in the stock price is primarily driven by recent positive performance metrics and increased promoter confidence.

View full answer

Who are in the management team of GMR Airports?

01-Sep-2026

The management team of GMR Airports includes G Mallikarjuna Rao (Non Executive Chairman), Kiran Kumar Grandhi (Managing Director & CEO), and several other directors, both executive and non-executive, bringing diverse expertise to the organization. Key members also include Madhva Bhimacharya Terdal, Srinivas Bommidala, and a group of Independent Non-Executive Directors.

The management team of GMR Airports includes the following key individuals:<BR><BR>1. **G Mallikarjuna Rao** - Non Executive Chairman<BR>2. **Kiran Kumar Grandhi** - Managing Director & CEO<BR>3. **Madhva Bhimacharya Terdal** - Executive Director & Whole-time Director<BR>4. **Srinivas Bommidala** - Non Executive Director<BR>5. **G B S Raju** - Non Executive Director<BR>6. **B V Nageswara Rao** - Non-Executive & Non-Independent Director<BR><BR>Additionally, the board includes several Independent Non-Executive Directors:<BR>- **Suresh Lilaram Narang**<BR>- **Subbarao Amarthaluru**<BR>- **Mundayat Ramachandran**<BR>- **Sadhu Ram Bansal**<BR>- **Emandi Sankara Rao**<BR>- **Bijal Tushar Ajinkya**<BR><BR>This team brings a diverse range of expertise and leadership to GMR Airports.

View full answer

What does GMR Airports do?

01-Sep-2026

GMR Airports Ltd operates in the transport infrastructure sector, focusing on airport development and management. As of June 2026, it reported net sales of ₹3,967 Cr and a net profit of ₹91 Cr, with a market cap of ₹102,158 Cr.

Overview:<BR>GMR Airports Ltd operates in the transport infrastructure sector and is categorized as a mid-cap company.<BR><BR>History:<BR>GMR Airports Limited was initially incorporated as 'Varalakshmi Vasavi Power Projects Limited' in the State of Andhra Pradesh on 23 May, 1996. The latest quarterly results reported net sales and net profit for the period ending June 2026.<BR><BR>Financial Snapshot:<BR>- Net Sales: 3,967 Cr (Quarterly Results - Jun 2026)<BR>- Net Profit: 91 Cr (Quarterly Results - Jun 2026)<BR>- Market Cap: INR 102,158 Cr (Mid Cap)<BR><BR>Key Metrics:<BR>- P/E: 165.00<BR>- Industry P/E: 43<BR>- Dividend Yield: 0.00%<BR>- Debt Equity: -15.32<BR>- Return on Equity: -10.23%<BR>- Price to Book: -41.98<BR><BR>Contact Details:<BR>- Address: Naman Centre 7th Flr P No C-31, G Blk Bandra(E) Bandra Kurla C Mumbai Maharashtra : 400051<BR>- Tel: 91-022-4202 8000<BR>- Email: Gil.Cosecy@gmrgroup.in<BR>- Website: http://www.gmrinfra.com

View full answer

Who are the peers of the GMR Airports?

01-Sep-2026

GMR Airports' peers include Adani Ports, JSW Infrastructure, Aegis Vopak Terminals, and others, with varying management risks and growth rates. GMR Airports has a below-average management risk and a 1-year return of 9.10%, lower than Shreeji Ship's 155.14% but higher than BF Utilities' -37.74%.

Peers: The peers of GMR Airports are Adani Ports, JSW Infrast, Aegis Vopak Term, Shreeji Ship. Gl, Guj Pipavav Port, BF Utilities, Allcargo Termi, Dreamfolks Servi, and Atlantaa.<BR><BR>Quality Snapshot: Excellent management risk is observed at JSW Infrast and Shreeji Ship. Gl, while Good management risk is found at Guj Pipavav Port. Average management risk is noted at Adani Ports, Aegis Vopak Term, BF Utilities, and Dreamfolks Servi, while Below Average management risk is seen at GMR Airports, Allcargo Termi, and Atlantaa. Growth is Excellent at JSW Infrast and Aegis Vopak Term, while Good growth is noted at JSW Infrast. Below Average growth is found at GMR Airports, Shreeji Ship. Gl, Guj Pipavav Port, BF Utilities, Allcargo Termi, Dreamfolks Servi, and Atlantaa. Capital Structure is Excellent at Shreeji Ship. Gl and Guj Pipavav Port, Below Average at Adani Ports, Aegis Vopak Term, BF Utilities, Allcargo Termi, and GMR Airports, while Good capital structure is seen at JSW Infrast.<BR><BR>Return Snapshot: The peer with the highest 1-year return is Shreeji Ship. Gl at 155.14%, while the peer with the lowest is BF Utilities at -37.74%. GMR Airports has a 1-year return of 9.10%, which is higher than BF Utilities but lower than Shreeji Ship. Gl. Additionally, peers with negative six-month returns include GMR Airports, BF Utilities, and Dreamfolks Servi.

View full answer

How big is GMR Airports?

01-Sep-2026

As of 31st August, GMR Airports Ltd has a market capitalization of 102,158.00 Cr, with recent net sales of 15,569.06 Cr and a net profit of 478.13 Cr. As of March 2026, the company reported shareholder's funds at a loss of 2,479.76 Cr and total assets valued at 54,141.57 Cr.

As of 31st August, GMR Airports Ltd has a market capitalization of 102,158.00 Cr, categorizing it as a Mid Cap company.<BR><BR>In the latest four quarters, GMR Airports reported Net Sales of 15,569.06 Cr and a Net Profit of 478.13 Cr.<BR><BR>As of March 2026, the company's Shareholder's Funds stood at a loss of 2,479.76 Cr, while Total Assets were valued at 54,141.57 Cr.

View full answer

Should I buy, sell or hold GMR Airports Ltd?

14-Aug-2026

Are GMR Airports Ltd latest results good or bad?

29-May-2026

GMR Airports Ltd's latest results are overall positive, showing a 148.17% increase in net profit and a 37.54% year-on-year growth in net sales, despite some operational challenges and high debt levels. While the performance indicates strong recovery, investors should be cautious due to the company's significant leverage and negative book value.

GMR Airports Ltd's latest results present a mixed but overall positive picture. In the quarter ending March 2026, the company reported a consolidated net profit of ₹302.35 crores, which is a remarkable 148.17% increase compared to the previous quarter. This indicates a strong recovery in profitability. Additionally, net sales reached ₹3,938.16 crores, reflecting a year-on-year growth of 37.54%, although there was a slight sequential decline of 1.40%.<BR><BR>The operating margin, while down from the previous quarter at 36.68%, still demonstrates healthy profitability compared to the same quarter last year, where it was 35.25%. This suggests that GMR Airports is effectively managing its operational efficiency despite the challenges posed by high fixed costs associated with airport operations.<BR><BR>However, the company continues to face significant challenges, particularly with elevated debt levels and a negative book value of ₹-2,503.42 crores. The debt-to-EBITDA ratio of 15.47 indicates a high leverage profile, which raises concerns about financial flexibility and sustainability.<BR><BR>Overall, while the quarterly performance shows strong growth in revenue and profit, the underlying issues related to debt and capital structure warrant cautious consideration. Investors may view the results as good in terms of operational performance but should remain aware of the financial risks involved.

View full answer

When is the next results date for GMR Airports Ltd?

10-Feb-2026

The next results date for GMR Airports Ltd is 13 February 2026.

The next results date for GMR Airports Ltd is scheduled for 13 February 2026.

View full answer

How has been the historical performance of GMR Airports?

14-Nov-2025

GMR Airports has shown significant revenue growth, with net sales increasing from 4,600.72 Cr in Mar'22 to 10,414.24 Cr in Mar'25, but continues to face profitability challenges, reporting losses of -1,001.72 Cr in profit after tax for Mar'25 despite a positive cash flow from operating activities of 3,442.00 Cr. Total liabilities rose to 48,156.50 Cr, indicating ongoing financial strain.

Answer:<BR>The historical performance of GMR Airports shows a fluctuating trend in key financial metrics over the years.<BR><BR>Breakdown:<BR>GMR Airports has experienced significant growth in net sales, increasing from 4,600.72 Cr in Mar'22 to 10,414.24 Cr in Mar'25, with a notable rise from 8,754.56 Cr in Mar'24. However, the company has faced challenges in profitability, as evidenced by its operating profit margin, which improved to 36.16% in Mar'25 from 33.88% in Mar'24, yet it has consistently reported negative profit before tax and profit after tax figures, with losses of -820.13 Cr and -1,001.72 Cr respectively in Mar'25. The total expenditure has also risen, reaching 6,648.31 Cr in Mar'25. On the balance sheet, total liabilities increased to 48,156.50 Cr in Mar'25, while total assets were reported at the same level, indicating a stable asset-liability ratio. Cash flow from operating activities was positive at 3,442.00 Cr in Mar'25, although the net cash outflow was -1,240.00 Cr, reflecting ongoing financial strain. Overall, while GMR Airports has shown revenue growth, it continues to grapple with profitability and cash flow challenges.

View full answer

Is GMR Airports technically bullish or bearish?

11-Nov-2025

As of November 10, 2025, GMR Airports is in a strong bullish trend, supported by positive MACD and moving averages, with a year-to-date return of 21.63% compared to the Sensex's 6.91%.

As of 10 November 2025, the technical trend has changed from mildly bullish to bullish. The current technical stance is bullish with strong indicators supporting this view. The MACD is bullish on both the weekly and monthly time frames, and the moving averages are bullish on the daily chart. The Bollinger Bands show a bullish trend on the monthly level, while the KST is bullish weekly but mildly bearish monthly. The Dow Theory indicates a mildly bullish stance on both weekly and monthly time frames. Overall, GMR Airports is positioned strongly in a bullish trend, supported by its recent performance against the Sensex, particularly with a year-to-date return of 21.63% compared to 6.91% for the index.

View full answer

Who are the top shareholders of the GMR Airports?

17-Jul-2025

The top shareholders of GMR Airports include Aeroports De Paris S.a. with 29.86%, promoters with 17.75% (of which 17.75% is pledged), foreign institutional investors at 15.09%, and mutual funds holding 2.4%. The highest public shareholder is Synergy Industrials, Metals And Power Holdings Ltd with 5.08%, while individual investors own 4.22%.

The top shareholders of GMR Airports include several key players. The largest shareholder is Aeroports De Paris S.a., holding 29.86% of the shares. Promoters collectively hold a significant portion, with 17.7492% of their holdings pledged. Additionally, foreign institutional investors (FIIs) own 15.09%, while mutual funds account for 2.4% through 30 different schemes. The highest public shareholder is Synergy Industrials, Metals And Power Holdings Ltd, with a 5.08% stake. Individual investors also have a presence, holding 4.22% of the shares.

View full answer

Is GMR Airports overvalued or undervalued?

09-Jun-2025

As of November 12, 2020, GMR Airports is considered overvalued and risky due to negative financial ratios, including a PE ratio of -98.31 and a price-to-book value of -36.40, which contrast sharply with its peers, indicating significant underlying issues despite a historically strong performance.

As of 12 November 2020, GMR Airports' valuation grade has moved from fair to risky, indicating a significant deterioration in its investment appeal. The company is currently overvalued, as evidenced by its troubling financial ratios, including a PE ratio of -98.31, a price-to-book value of -36.40, and an EV to EBITDA ratio of 33.47. These figures highlight severe underlying issues, particularly the negative earnings and book value.<BR><BR>In comparison to its peers, GMR Airports stands out unfavorably; for instance, Larsen & Toubro, which is rated attractive, has a PE ratio of 34.21 and an EV to EBITDA of 17.35. Other peers like Siemens and CG Power & Ind are categorized as very expensive, with PE ratios of 56.88 and 107.03, respectively. The stark contrast in valuation metrics underscores GMR Airports' precarious position in the transport infrastructure sector. Despite a strong historical performance over the long term, recent stock performance relative to the Sensex shows a decline of 0.15% over the past year, further supporting the conclusion that the company is currently overvalued.

View full answer

Has GMR Airports declared dividend?

06-Jun-2025

GMR Airports Ltd has declared a 10% dividend, amounting to 0.1 per share, but the dividend yield is 0%. Total returns have primarily come from price appreciation, with significant growth over various periods, including a 326.49% return over the past 5 years.

GMR Airports Ltd has declared a 10% dividend.<BR><BR>Dividend Details:<BR>- Percentage announced: 10%<BR>- Amount per share: 0.1<BR>- Ex-date: 09 Sep 14<BR><BR>Dividend Yield: 0%<BR><BR>Total Returns by Period:<BR>In the last 6 months, GMR Airports Ltd experienced a price return of 1.92%, with no dividend return, resulting in a total return of 1.92%.<BR><BR>Over the past year, the company had a price return of 2.17%, with no dividend return, leading to a total return of 2.17%.<BR><BR>In the 2-year period, GMR Airports Ltd saw a price return of 106.99%, with no dividend return, culminating in a total return of 106.99%.<BR><BR>For the 3-year period, the price return was 132.21%, with no dividend return, resulting in a total return of 132.21%.<BR><BR>In the last 4 years, the company achieved a price return of 229.45%, with no dividend return, leading to a total return of 229.45%.<BR><BR>Finally, over the past 5 years, GMR Airports Ltd recorded a price return of 326.49%, with no dividend return, resulting in a total return of 326.49%.<BR><BR>Overall, while GMR Airports Ltd has declared a dividend, the dividend yield remains at 0%, indicating that the returns have primarily come from price appreciation rather than dividend income. The total returns over various periods show significant growth, particularly in the longer term.

View full answer
iScoreScore
Click here to find our call on this stock
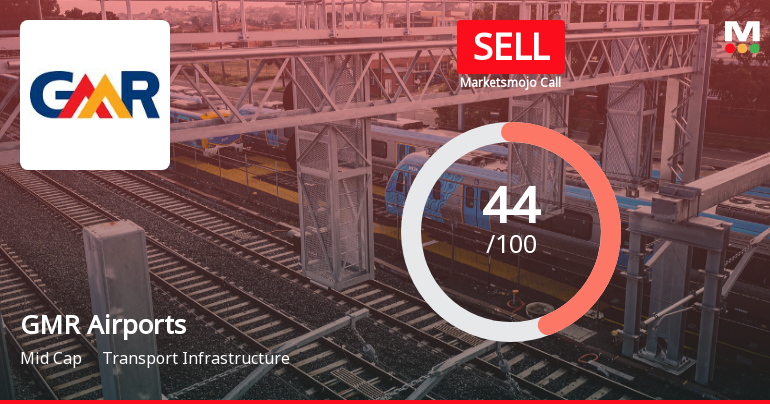
Strong Sell
Sell
Hold
Buy
Strong Buy

Dashboard

1

With a Negative Book Value, the company has a Weak Long Term Fundamental Strength

  • Poor long term growth as Net Sales has grown by an annual rate of 17.77% and Operating profit at -0.73% over the last 5 years
  • The company has a negative book value of Rs 2,479.76 crore
2

Risky - Negative Book Value

stock-summaryMojo Parameters

Mojo Parameters

Loading Valuation Snapshot...

Stock DNA

stock-summary
Industry

Transport Infrastructure

stock-summary
Market cap

INR 104,777 Cr (Mid Cap)

stock-summary
P/E

173.00

stock-summary
Industry P/E

10

stock-summary
Dividend Yield

0.00%

stock-summary
Debt Equity

-15.32

stock-summary
Return on Equity

-10.23%

stock-summary
Price to Book

-41.93

Revenue and Profits:
Net Sales:
3,967 Cr
(Quarterly Results - Jun 2026)
Net Profit:
91 Cr
stock-summaryTotal Returns
Total Returns (Price + Dividend) stock-summary
Dividend Yield (0%)
TimePeriod
Price Return
Dividend Return
Total Return
3 Months
-9.36%
0%
-9.36%
6 Months
8.38%
0%
8.38%
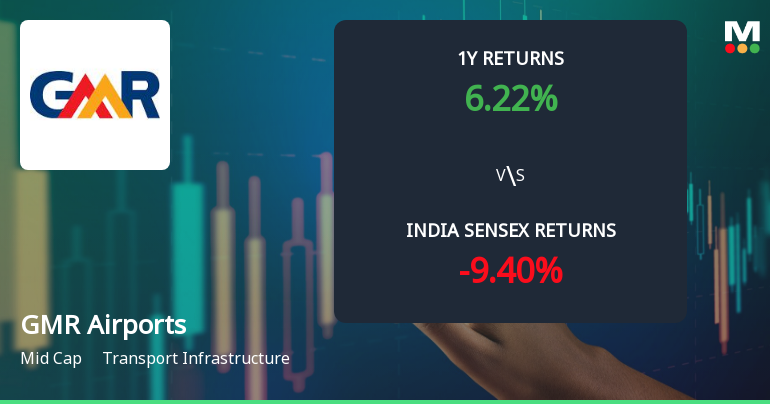
1 Year
7.52%
0%
7.52%
2 Years
3.57%
0%
3.57%
3 Years
67.46%
0%
67.46%
4 Years
158.31%
0%
158.31%
5 Years
199.15%
0%
199.15%

Latest dividend: 0.08870078740157482 per share ex-dividend date: Sep-09-2014

Risk Adjusted Returns v/s stock-summary
Returns Beta
Icon
Beta has not been calculated since enough price history is not available
stock-summaryNews & Corporate Actions

News

Announcements stock-summary

Update On Tariff Matters

20-Sep-2026 | Source : BSE

Update on Tariff Matters in relation to Delhi International Airport Limited Subsidiary of the Company

ESG Rating

18-Sep-2026 | Source : BSE

ESG Rating

Monthly Traffic Updates- August 2026

15-Sep-2026 | Source : BSE

Monthly Traffic Updates- August 2026

Corporate Actions stock-summary

stock-summary
BOARD MEETING

No Upcoming Board Meetings

stock-summary
DIVIDEND

GMR Airports Ltd has declared 10% dividend, ex-date: 09 Sep 14

stock-summary
SPLITS

GMR Airports Ltd has announced 1:2 stock split, ex-date: 01 Oct 09

stock-summary
BONUS

No Bonus history available

stock-summary
RIGHTS

GMR Airports Ltd has announced 3:14 rights issue, ex-date: 11 Mar 15

stock-summaryKey Factors

Quality key factors stock-summary

Factor
Value
Sales Growth (5y)
17.77%
EBIT Growth (5y)
50.58%
EBIT to Interest (avg)
0.50
Debt to EBITDA (avg)
14.50
Net Debt to Equity (avg)
-15.32
Sales to Capital Employed (avg)
0.26
Tax Ratio
10.79%
Dividend Payout Ratio
0
Pledged Shares
16.44%
Institutional Holding
26.87%
ROCE (avg)
5.31%
ROE (avg)
0

Valuation key factors

Factor
Value
P/E Ratio
173
Industry P/E
10
Price to Book Value
-41.93
EV to EBIT
33.50
EV to EBITDA
23.50
EV to Capital Employed
4.00
EV to Sales
9.12
PEG Ratio
1.09
Dividend Yield
NA
ROCE (Latest)
11.04%
ROE (Latest)
Negative BV

Technicals key factors

Indicator
Weekly
Monthly
MACD
Bearish
Mildly Bearish
RSI
No Signal
No Signal
Bollinger Bands
Mildly Bearish
Bullish
Moving Averages
Mildly Bullish (Daily)
KST
Mildly Bearish
Mildly Bearish
Dow Theory
Mildly Bullish
Mildly Bearish
OBV
No Trend
No Trend
stock-summary Technical Indicator Scale: Bearish, Mildly Bearish, Sideways, Mildly Bullish, Bullish  Turned 
stock-summaryShareholding
Shareholding Snapshot : Jun 2026stock-summary
Shareholding Compare (%holding) stock-summary
Majority shareholders

Promoters

Pledged Promoter Holdings

16.442

Mutual Funds

Held by 35 Schemes (2.51%)

FIIs

Held by 716 FIIs (21.74%)

Promoter with highest holding

Aeroports De Paris S.a. (26.46%)

Highest Public shareholder

Gram Limited (2.6%)

Individual Investors Holdings

2.61%

stock-summaryFinancial
[
  {
    "link": "quarterly",
    "btn_text": "All Quarterly Results",
    "header": "Quarterly Results Snapshot (Consolidated) - Jun'26 - YoY",
    "rhs": [
      {
        "prefix": "Net Sales ",
        "suffix": "YoY Growth in quarter ended Jun 2026 is 23.76% vs 33.43% in Jun 2025",
        "dir": -1
      },
      {
        "prefix": "Consolidated Net Profit ",
        "suffix": "YoY Growth in quarter ended Jun 2026 is 143.03% vs -49.38% in Jun 2025",
        "dir": 1
      }
    ],
    "table": {
      "header": [
        "Jun'26",
        "Jun'25",
        "Change(%)"
      ],
      "body": [
        {
          "field": "Net Sales",
          "val1": "3,966.88",
          "val2": "3,205.23",
          "chgp": "23.76%",
          "chgp_class": "positive"
        },
        {
          "field": "Operating Profit (PBDIT) excl Other Income",
          "val1": "1,450.01",
          "val2": "1,164.67",
          "chgp": "24.50%",
          "chgp_class": "positive"
        },
        {
          "field": "Interest",
          "val1": "937.93",
          "val2": "949.10",
          "chgp": "-1.18%",
          "chgp_class": "positive"
        },
        {
          "field": "Exceptional Items",
          "val1": "0.00",
          "val2": "46.02",
          "chgp": "-100.00%",
          "chgp_class": "negative"
        },
        {
          "field": "Consolidate Net Profit",
          "val1": "91.04",
          "val2": "-211.59",
          "chgp": "143.03%",
          "chgp_class": "positive"
        },
        {
          "field": "Operating Profit Margin (Excl OI)",
          "val1": "36.58%",
          "val2": "36.34%",
          "chgp": "0.24%",
          "chgp_class": "positive"
        }
      ]
    }
  },
  {
    "link": "half-yearly",
    "btn_text": "All Half Yearly Results",
    "header": "Half Yearly Results Snapshot (Consolidated) - Sep'25",
    "rhs": [
      {
        "prefix": "Net Sales ",
        "suffix": " Growth in half year ended Sep 2025 is 40.38% vs 20.01% in Sep 2024",
        "dir": 1
      },
      {
        "prefix": "Consolidated Net Profit ",
        "suffix": " Growth in half year ended Sep 2025 is 41.08% vs -143.24% in Sep 2024",
        "dir": 1
      }
    ],
    "table": {
      "header": [
        "Sep'25",
        "Sep'24",
        "Change(%)"
      ],
      "body": [
        {
          "field": "Net Sales",
          "val1": "6,875.22",
          "val2": "4,897.66",
          "chgp": "40.38%",
          "chgp_class": "positive"
        },
        {
          "field": "Operating Profit (PBDIT) excl Other Income",
          "val1": "2,611.70",
          "val2": "1,755.43",
          "chgp": "48.78%",
          "chgp_class": "positive"
        },
        {
          "field": "Interest",
          "val1": "1,991.68",
          "val2": "1,920.37",
          "chgp": "3.71%",
          "chgp_class": "negative"
        },
        {
          "field": "Exceptional Items",
          "val1": "81.02",
          "val2": "108.73",
          "chgp": "-25.49%",
          "chgp_class": "negative"
        },
        {
          "field": "Consolidate Net Profit",
          "val1": "-248.68",
          "val2": "-422.05",
          "chgp": "41.08%",
          "chgp_class": "positive"
        },
        {
          "field": "Operating Profit Margin (Excl OI)",
          "val1": "37.99%",
          "val2": "35.84%",
          "chgp": "2.15%",
          "chgp_class": "positive"
        }
      ]
    }
  },
  {
    "link": "nine-monthly",
    "btn_text": "All Nine Monthly Results",
    "header": "Nine Monthly Results Snapshot (Consolidated) - Dec'25",
    "rhs": [
      {
        "prefix": "Net Sales ",
        "suffix": "YoY Growth in nine months ended Dec 2025 is 43.95% vs 19.71% in Dec 2024",
        "dir": 1
      },
      {
        "prefix": "Consolidated Net Profit ",
        "suffix": "YoY Growth in nine months ended Dec 2025 is 18.30% vs 68.38% in Dec 2024",
        "dir": -1
      }
    ],
    "table": {
      "header": [
        "Dec'25",
        "Dec'24",
        "Change(%)"
      ],
      "body": [
        {
          "field": "Net Sales",
          "val1": "10,869.25",
          "val2": "7,550.90",
          "chgp": "43.95%",
          "chgp_class": "positive"
        },
        {
          "field": "Operating Profit (PBDIT) excl Other Income",
          "val1": "4,312.24",
          "val2": "2,747.14",
          "chgp": "56.97%",
          "chgp_class": "positive"
        },
        {
          "field": "Interest",
          "val1": "2,908.62",
          "val2": "2,749.51",
          "chgp": "5.79%",
          "chgp_class": "negative"
        },
        {
          "field": "Exceptional Items",
          "val1": "-102.10",
          "val2": "517.33",
          "chgp": "-119.74%",
          "chgp_class": "negative"
        },
        {
          "field": "Consolidate Net Profit",
          "val1": "-126.85",
          "val2": "-155.26",
          "chgp": "18.30%",
          "chgp_class": "positive"
        },
        {
          "field": "Operating Profit Margin (Excl OI)",
          "val1": "39.67%",
          "val2": "36.38%",
          "chgp": "3.29%",
          "chgp_class": "positive"
        }
      ]
    }
  },
  {
    "link": "annual",
    "btn_text": "All Annual Results",
    "header": "Annual Results Snapshot (Consolidated) - Mar'26",
    "rhs": [
      {
        "prefix": "Net Sales ",
        "suffix": "YoY Growth in year ended Mar 2026 is 42.18% vs 18.96% in Mar 2025",
        "dir": 1
      },
      {
        "prefix": "Consolidated Net Profit ",
        "suffix": "YoY Growth in year ended Mar 2026 is 144.67% vs 29.76% in Mar 2025",
        "dir": 1
      }
    ],
    "table": {
      "header": [
        "Mar'26",
        "Mar'25",
        "Change(%)"
      ],
      "body": [
        {
          "field": "Net Sales",
          "val1": "14,807.41",
          "val2": "10,414.24",
          "chgp": "42.18%",
          "chgp_class": "positive"
        },
        {
          "field": "Operating Profit (PBDIT) excl Other Income",
          "val1": "5,756.91",
          "val2": "3,765.93",
          "chgp": "52.87%",
          "chgp_class": "positive"
        },
        {
          "field": "Interest",
          "val1": "3,858.53",
          "val2": "3,704.67",
          "chgp": "4.15%",
          "chgp_class": "negative"
        },
        {
          "field": "Exceptional Items",
          "val1": "-108.50",
          "val2": "607.39",
          "chgp": "-117.86%",
          "chgp_class": "negative"
        },
        {
          "field": "Consolidate Net Profit",
          "val1": "175.49",
          "val2": "-392.85",
          "chgp": "144.67%",
          "chgp_class": "positive"
        },
        {
          "field": "Operating Profit Margin (Excl OI)",
          "val1": "38.88%",
          "val2": "36.16%",
          "chgp": "2.72%",
          "chgp_class": "positive"
        }
      ]
    }
  }
]

Quarterly Results Snapshot (Consolidated) - Jun'26 - YoYstock-summary

Jun'26
Jun'25
Change(%)
Net Sales
3,966.88
3,205.23
23.76%
Operating Profit (PBDIT) excl Other Income
1,450.01
1,164.67
24.50%
Interest
937.93
949.10
-1.18%
Exceptional Items
0.00
46.02
-100.00%
Consolidate Net Profit
91.04
-211.59
143.03%
Operating Profit Margin (Excl OI)
36.58%
36.34%
0.24%
Values in Rs Cr.
Direction Arrows
Net Sales

YoY Growth in quarter ended Jun 2026 is 23.76% vs 33.43% in Jun 2025

Direction Arrows
Consolidated Net Profit

YoY Growth in quarter ended Jun 2026 is 143.03% vs -49.38% in Jun 2025

Half Yearly Results Snapshot (Consolidated) - Sep'25stock-summary

Sep'25
Sep'24
Change(%)
Net Sales
6,875.22
4,897.66
40.38%
Operating Profit (PBDIT) excl Other Income
2,611.70
1,755.43
48.78%
Interest
1,991.68
1,920.37
3.71%
Exceptional Items
81.02
108.73
-25.49%
Consolidate Net Profit
-248.68
-422.05
41.08%
Operating Profit Margin (Excl OI)
37.99%
35.84%
2.15%
Values in Rs Cr.
Direction Arrows
Net Sales

Growth in half year ended Sep 2025 is 40.38% vs 20.01% in Sep 2024

Direction Arrows
Consolidated Net Profit

Growth in half year ended Sep 2025 is 41.08% vs -143.24% in Sep 2024

Nine Monthly Results Snapshot (Consolidated) - Dec'25stock-summary

Dec'25
Dec'24
Change(%)
Net Sales
10,869.25
7,550.90
43.95%
Operating Profit (PBDIT) excl Other Income
4,312.24
2,747.14
56.97%
Interest
2,908.62
2,749.51
5.79%
Exceptional Items
-102.10
517.33
-119.74%
Consolidate Net Profit
-126.85
-155.26
18.30%
Operating Profit Margin (Excl OI)
39.67%
36.38%
3.29%
Values in Rs Cr.
Direction Arrows
Net Sales

YoY Growth in nine months ended Dec 2025 is 43.95% vs 19.71% in Dec 2024

Direction Arrows
Consolidated Net Profit

YoY Growth in nine months ended Dec 2025 is 18.30% vs 68.38% in Dec 2024

Annual Results Snapshot (Consolidated) - Mar'26stock-summary

Mar'26
Mar'25
Change(%)
Net Sales
14,807.41
10,414.24
42.18%
Operating Profit (PBDIT) excl Other Income
5,756.91
3,765.93
52.87%
Interest
3,858.53
3,704.67
4.15%
Exceptional Items
-108.50
607.39
-117.86%
Consolidate Net Profit
175.49
-392.85
144.67%
Operating Profit Margin (Excl OI)
38.88%
36.16%
2.72%
Values in Rs Cr.
Direction Arrows
Net Sales

YoY Growth in year ended Mar 2026 is 42.18% vs 18.96% in Mar 2025

Direction Arrows
Consolidated Net Profit

YoY Growth in year ended Mar 2026 is 144.67% vs 29.76% in Mar 2025

stock-summaryCompany CV
About GMR Airports Ltd stock-summary
stock-summary
GMR Airports Ltd
Mid Cap
Transport Infrastructure
GMR Airports Limited was initially incorporated as 'Varalakshmi Vasavi Power Projects Limited' in the State of Andhra Pradesh on 23 May, 1996.
Company Coordinates stock-summary
Company Details
Naman Centre 7th Flr P No C-31, G Blk Bandra(E) Bandra Kurla C Mumbai Maharashtra : 400051
stock-summary
Tel: 91-022-4202 8000
stock-summary
Gil.Cosecy@gmrgroup.in
Registrar Details
Karvy Computershare Pvt Ltd, Plot No 17-24 , Near Image Hospital,, Reliance Cybervilae,Vithalrao Nagar,, Madhapur, Hyderabad