
Compare GNG Electronics with Similar Stocks
Stock DNA
IT - Hardware
INR 4,777 Cr (Small Cap)
36.00
31
0.00%
0.42
17.42%
5.93
Total Returns (Price + Dividend) 
GNG Electronics for the last several years.
Risk Adjusted Returns v/s
Returns Beta

News
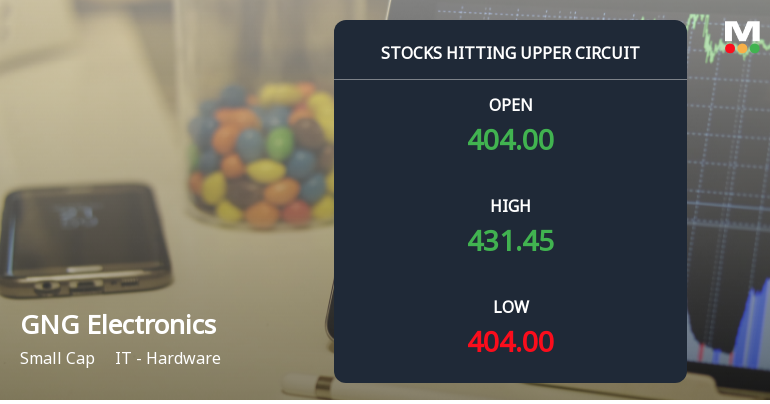
Above All Moving Averages and Now at Upper Circuit: GNG Electronics Ltd Gains 7.4% in a Single Session
At Rs 431.85, the buying was done — not because demand dried up, but because the exchange wouldn't let the stock go any higher. GNG Electronics Ltd locked at its upper circuit of 7.42% on 11 Jun 2026, with buyers queuing and no sellers willing to part with shares.
Read full news article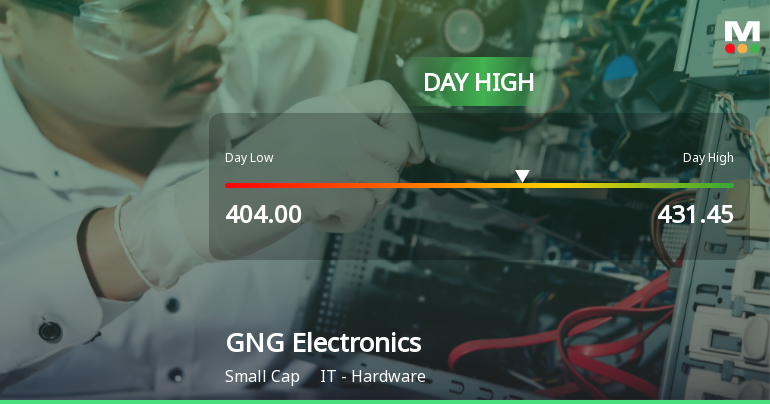
GNG Electronics Ltd Surges 7.58% to Day's High of Rs 431.45 — Outperforms Sector by 4.01 Percentage Points
The Sensex gained a modest 0.39% on 11 Jun 2026, while GNG Electronics Ltd surged 7.58%, reaching an intraday high of Rs 431.45. This 4.01 percentage-point outperformance over its IT - Hardware sector peers highlights a distinctly stock-specific rally rather than a broad market lift.
Read full news article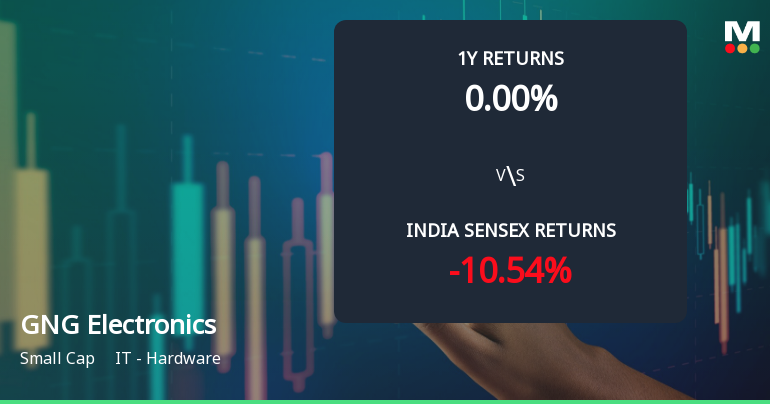
GNG Electronics Ltd Technical Momentum Shifts Amid Mixed Market Signals
GNG Electronics Ltd, a small-cap player in the IT - Hardware sector, has experienced a notable shift in its technical momentum, reflecting a complex interplay of bullish and bearish signals across key indicators. Despite a recent price decline, the stock’s year-to-date return significantly outpaces the broader Sensex, prompting a reassessment of its technical outlook and investment potential.
Read full news article Announcements
Announcement Under Regulation 30 (LODR) - Grant Of Stock Options
28-May-2026 | Source : BSEGrant of Stock Options under Electronics Bazaar Employees Stock Option Scheme - 2024
Announcement under Regulation 30 (LODR)-Earnings Call Transcript
11-May-2026 | Source : BSEGNG Electronics Limited has informed the Exchange regarding the transcript of the Earnings Call with Analysts/Investors held on May 05 2026
Announcement under Regulation 30 (LODR)-Newspaper Publication
07-May-2026 | Source : BSEGNG Electronics Limited has informed the Exchange regarding the Newspaper Publication in which the Financial Results of Company for quarter and year ended March 31 2026 is published.
Corporate Actions

No Upcoming Board Meetings

No Dividend history available

No Splits history available

No Bonus history available

No Rights history available
Quality key factors
Valuation key factors
Technicals key factors
 Technical Indicator Scale: Bearish, Mildly Bearish, Sideways, Mildly Bullish, Bullish Turned
 Shareholding Snapshot : Mar 2026
Shareholding Compare (%holding)
Promoters
None
Held by 5 Schemes (3.0%)
Held by 14 FIIs (2.78%)
Amiable Electronics Private Limited (46.64%)
Amit Midha (4.25%)
6.86%
Quarterly Results Snapshot (Standalone) - Mar'26 - QoQ

QoQ Growth in quarter ended Mar 2026 is 31.84% vs 3.67% in Dec 2025

QoQ Growth in quarter ended Mar 2026 is 23.15% vs 26.77% in Dec 2025
Half Yearly Results Snapshot (Standalone) - Sep'25
Not Applicable: The company has declared_date for only one period
Not Applicable: The company has declared_date for only one period
Nine Monthly Results Snapshot (Standalone) - Dec'25
Not Applicable: The company has declared_date for only one period
Not Applicable: The company has declared_date for only one period
Annual Results Snapshot (Consolidated) - Mar'26
YoY Growth in year ended Mar 2026 is 34.01% vs 23.98% in Mar 2025
YoY Growth in year ended Mar 2026 is 91.25% vs 32.39% in Mar 2025
About GNG Electronics Ltd

Company Coordinates


