Go Digit General

  • Market Cap: Small Cap
  • Industry: Insurance
  • ISIN: INE03JT01014
  • NSEID: GODIGIT
  • BSEID: 544179
INR
260.40
2.15 (0.83%)
BSENSE

Sep 01, 03:30 PM

BSE+NSE Vol: 1.81 lacs

  • Price Points
  • Score
  • Mojo Parameters
  • Total Return
  • News and Corporate Actions
  • Key factors
  • Shareholding
  • Financials
  • CompanyCV
stock-summaryPrice Point
High/Low

1Day

52 Week

Valuation
Technical
Day's Volume

CASH

1.81 lacs (-25.01%) Volume

Shareholding (Jun 2026)

FII

8.23%

Held by 101 FIIs

DII

15.01%

Held by 32 DIIs

Promoter

73.00%

Why is Go Digit General Insurance Ltd falling/rising?

02-Sep-2026

As of 01-Sep, Go Digit General Insurance Ltd's stock price is rising to Rs 260.40, reflecting a short-term recovery despite long-term underperformance and bearish trends. The stock faces challenges due to declining investor confidence and high valuation concerns, despite strong fundamentals.

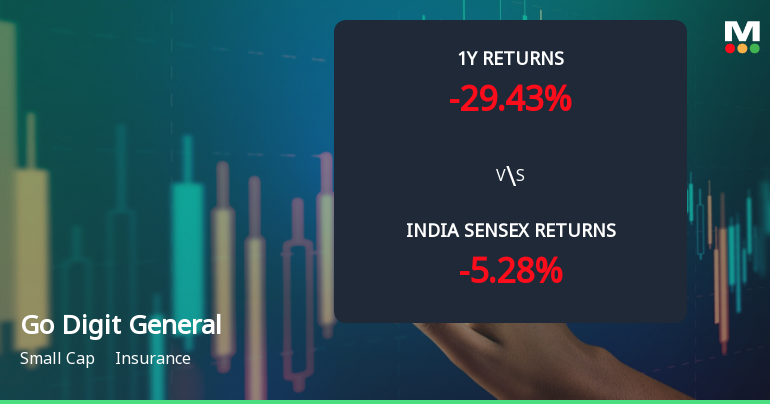
As of 01-Sep, Go Digit General Insurance Ltd's stock price is rising, currently at Rs 260.40, reflecting a change of 2.15 (0.83%) upward. This increase can be attributed to its performance today, where it outperformed the sector by 1.92%. Despite the stock touching an intraday low of Rs 252.5 earlier in the day, the overall positive movement indicates a recovery from that low.<BR><BR>However, it is important to note that the stock has been underperforming in the long term, with a year-to-date decline of 24.37% and a one-year drop of 26.66%. Additionally, the stock is trading below its moving averages across various time frames, indicating a bearish trend. The falling investor participation, with a significant drop in delivery volume by 35.86% against the five-day average, suggests a lack of confidence among retail investors.<BR><BR>On a positive note, the company has shown strong long-term fundamental strength, with a 61.61% compound annual growth rate in operating profits and high institutional holdings at 23.24%, which have increased by 0.6% over the previous quarter. However, the recent flat results, including a 36.5% drop in PAT compared to the previous four-quarter average, and a low EPS of Rs 0.93, contribute to concerns about its valuation, which is considered expensive relative to its peers.<BR><BR>In summary, while the stock is experiencing a rise today, the broader context of its performance and investor sentiment indicates ongoing challenges that could affect its future trajectory.

View full answer

What does Go Digit General do?

01-Sep-2026

Go Digit General Insurance Ltd, a small-cap company established in 2016, provides insurance services and reported net sales of ₹2,007 Cr and a net profit of ₹86 Cr for June 2026. Key metrics include a P/E ratio of 48.00 and a market cap of ₹23,772 Cr.

Overview:<BR>Go Digit General Insurance Ltd operates in the insurance industry and is categorized as a small-cap company.<BR><BR>History:<BR>The company was incorporated in 2016 as Oben General Insurance Limited and later renamed Go Digit General Insurance Limited in 2017. The latest quarterly results reported net sales and net profit for June 2026.<BR><BR>Financial Snapshot:<BR>Most recent Net Sales: 2,007 Cr (Quarterly Results - Jun 2026) <BR>Most recent Net Profit: 86 Cr (Quarterly Results - Jun 2026) <BR>Market-cap value: INR 23,772 Cr (Small Cap)<BR><BR>Key Metrics:<BR>P/E: 48.00 <BR>Industry P/E: 21 <BR>Dividend Yield: 0.00% <BR>Debt-Equity: 0.08 <BR>Return on Equity: 10.56% <BR>Price to Book: 5.16 <BR><BR>Contact Details:<BR>Details: No Company Details Available <BR>Registrar Address: Not available.

View full answer

Who are the peers of the Go Digit General?

01-Sep-2026

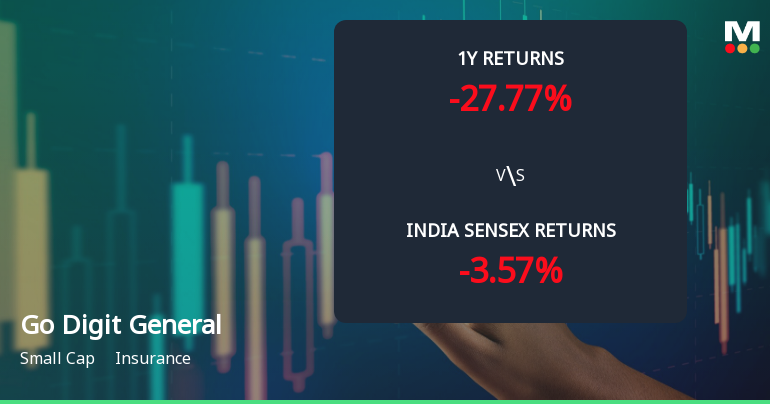
Go Digit General's peers include HDFC Life Insurance, ICICI Lombard, ICICI Prudential Life, General Insurance, Max Financial, Star Health Insurance, New India Assurance, Niva Bupa Health, and Medi Assist Services. In terms of management risk and growth, Niva Bupa Health shows excellent performance, while Go Digit General has average growth and a 1-year return of -27.77%.

Peers: The peers of Go Digit General are HDFC Life Insur., ICICI Lombard, ICICI Pru Life, General Insuranc, Max Financial, Star Health Insu, New India Assura, Niva Bupa Health, Medi Assist Ser.<BR><BR>Quality Snapshot: Excellent management risk is observed at ICICI Lombard, while Good management risk is found at General Insuranc and Medi Assist Ser. Average management risk is present at HDFC Life Insur., ICICI Pru Life, Max Financial, Star Health Insu, and Niva Bupa Health, and the rest. Below Average management risk is noted at New India Assura. In terms of Growth, Excellent growth is seen at Niva Bupa Health, while Average growth is found at Go Digit General, HDFC Life Insur., ICICI Lombard, General Insuranc, and the rest. Below Average growth is noted at ICICI Pru Life, Max Financial, Star Health Insu, and New India Assura.<BR><BR>Return Snapshot: The peer with the highest 1-year return is Star Health Insu at 26.81%, while the peer with the lowest is Medi Assist Ser. at -34.99%. Go Digit General's 1-year return is -27.77%, which is better than Medi Assist Ser. but worse than Star Health Insu. Additionally, the six-month return is negative for HDFC Life Insur., ICICI Lombard, ICICI Pru Life, Max Financial, Go Digit General, Medi Assist Ser., and the rest.

View full answer

How big is Go Digit General?

01-Sep-2026

As of 31st August, Go Digit General Insurance Ltd has a market capitalization of 23,772.00 Cr, with recent net sales of 8,556.30 Cr and a net profit of 492.41 Cr. The company reported shareholder's funds of 4,662.55 Cr and total assets of 24,950.50 Cr for the annual period ending March 2026.

As of 31st August, Go Digit General Insurance Ltd has a market capitalization of 23,772.00 Cr, categorizing it as a Small Cap company.<BR><BR>In the latest four quarters, Go Digit General reported Net Sales of 8,556.30 Cr and a Net Profit of 492.41 Cr.<BR><BR>For the latest annual period ending in March 2026, the company had Shareholder's Funds amounting to 4,662.55 Cr and Total Assets of 24,950.50 Cr.

View full answer

Are Go Digit General Insurance Ltd latest results good or bad?

24-Jul-2026

Go Digit General Insurance Ltd's latest results are unfavorable, showing a 37.52% decline in net profit for Q1 FY27 and a decrease in profit margin, despite a year-on-year premium growth of 7.61%. The company's stock has also underperformed, declining by 26.77% over the past year, indicating ongoing profitability and operational challenges.

Go Digit General Insurance Ltd's latest results indicate a challenging quarter. The company reported a net profit of ₹86.39 crores for Q1 FY27, which is a significant decline of 37.52% compared to the previous quarter. Additionally, the profit after tax (PAT) margin has compressed to 4.30%, down from 6.49% in the previous quarter, reflecting deteriorating operational efficiency.<BR><BR>While the company did achieve a year-on-year premium growth of 7.61%, it faced a quarter-on-quarter decline in gross written premium of 12.78%. This disconnect between top-line growth and bottom-line performance raises concerns about the sustainability of its growth trajectory.<BR><BR>Moreover, Go Digit's stock has underperformed significantly over the past year, declining by 26.77%, which is notably worse than the broader market and the insurance sector. The overall financial performance suggests that the company is grappling with profitability challenges and operational inefficiencies, making the latest results appear unfavorable.

View full answer

Should I buy, sell or hold Go Digit General Insurance Ltd?

24-Jul-2026

When is the next results date for Go Digit General Insurance Ltd?

16-Jul-2026

The next results date for Go Digit General Insurance Ltd is 23 July 2026.

The next results date for Go Digit General Insurance Ltd is scheduled for 23 July 2026.

View full answer

Is Go Digit General technically bullish or bearish?

05-Dec-2025

As of December 4, 2025, the market trend is neutral with weak bullish signals from daily moving averages, while weekly indicators show mild bearishness, indicating a lack of strong momentum in either direction.

As of 4 December 2025, the technical trend has changed from mildly bullish to sideways. The current technical stance is neutral, with weak bullish signals primarily from the daily moving averages. However, the weekly MACD and KST are mildly bearish, and the Bollinger Bands indicate a bearish trend on the weekly timeframe. The RSI shows no signals on both weekly and monthly timeframes, and the Dow Theory indicates no trend in either timeframe. Overall, the indicators suggest a lack of strong momentum in either direction, leading to a neutral stance.

View full answer

How has been the historical performance of Go Digit General?

28-Oct-2025

Go Digit General has shown significant growth in net sales and profitability, with total operating income rising to 9,370.72 Cr in Mar'25 and a recovery in profit before tax to 424.94 Cr, compared to losses in previous years. Total assets increased to 21,460.94 Cr, reflecting a strong recovery and growth trajectory.

Answer:<BR>The historical performance of Go Digit General shows significant growth in net sales and profitability over the past few years.<BR><BR>Breakdown:<BR>Go Digit General has demonstrated a strong upward trend in net sales, increasing from 3,840.96 Cr in Mar'22 to 8,045.96 Cr in Mar'25. Other operating income also saw growth, reaching 1,324.76 Cr in Mar'25, contributing to a total operating income of 9,370.72 Cr for the same period. The company's total expenditure, excluding depreciation, rose to 9,270.61 Cr in Mar'25, but operating profit (PBDIT) improved significantly to 424.94 Cr, compared to a loss of 286.38 Cr in Mar'24. Profit before tax and profit after tax both stood at 424.94 Cr in Mar'25, marking a substantial recovery from previous years, including a loss of 295.86 Cr in Mar'22. The earnings per share (EPS) also increased to 4.6 in Mar'25 from a negative EPS of -3.44 in Mar'22. On the balance sheet, total assets grew to 21,460.94 Cr in Mar'25, up from 10,047.73 Cr in Mar'22, while total liabilities also increased to 21,460.94 Cr. Cash flow from operating activities was 1,604.00 Cr in Mar'25, although cash flow from investing activities was negative at -2,837.00 Cr, resulting in a net cash outflow of -141.00 Cr. Overall, Go Digit General's financial performance reflects a strong recovery and growth trajectory over the past few years.

View full answer

Who are the top shareholders of the Go Digit General?

17-Jul-2025

The top shareholders of Go Digit General include Go Digit Infoworks Services Private Limited with 73.11%, mutual funds at 6.75%, foreign institutional investors at 7.85%, and individual investors holding 2.23%. The largest public shareholder is Mirae Asset Large & Midcap Fund with a 4.74% stake.

The top shareholders of Go Digit General include the promoters, with Go Digit Infoworks Services Private Limited holding the largest stake at 73.11%. Additionally, mutual funds collectively hold 6.75% through 17 schemes, while foreign institutional investors (FIIs) own 7.85% across 94 entities. The highest public shareholder is Mirae Asset Large & Midcap Fund, which has a stake of 4.74%. Individual investors account for 2.23% of the holdings.

View full answer

Is Go Digit General overvalued or undervalued?

09-Jun-2025

As of June 2, 2024, Go Digit General is considered very expensive and overvalued with a PE ratio of 76.36 and low financial performance metrics, despite a recent short-term stock outperformance compared to the Sensex.

As of 2 June 2024, the valuation grade for Go Digit General has moved from does not qualify to very expensive, indicating a significant shift in its perceived value. The company is currently considered overvalued based on its high ratios, including a PE ratio of 76.36, an EV to EBIT of 325.24, and an EV to EBITDA of 325.24. These figures starkly contrast with its peers, such as Life Insurance with a PE of 12.54 and Bajaj Finance Ltd. with a PE of 35.01, highlighting the disparity in valuation within the industry.<BR><BR>In comparison to its peers, Go Digit General's valuation metrics suggest that it is not only overvalued but also lacks the financial performance to justify such high multiples, evidenced by a ROE of 9.27% and a ROCE of just 2.13%. Furthermore, while the company's stock has outperformed the Sensex in the short term, with a 1-month return of 20.34% compared to the Sensex's 3.82%, this does not mitigate the overall overvaluation concern.

View full answer

Has Go Digit General declared dividend?

06-Jun-2025

No Dividend History Available

iScoreScore
Click here to find our call on this stock
Strong Sell
Sell
Hold
Buy
Strong Buy

Dashboard

1

Flat results in Jun 26

  • PAT(Q) At Rs 86.39 cr has Fallen at -36.5% (vs previous 4Q average)
  • EPS(Q) Lowest at Rs 0.93
2

With ROE of 10.6, it has a Very Expensive valuation with a 5.1 Price to Book Value

3

Below par performance in long term as well as near term

stock-summaryMojo Parameters

Mojo Parameters

Loading Valuation Snapshot...

Stock DNA

stock-summary
Industry

Insurance

stock-summary
Market cap

INR 23,577 Cr (Small Cap)

stock-summary
P/E

49.00

stock-summary
Industry P/E

21

stock-summary
Dividend Yield

0.00%

stock-summary
Debt Equity

0.08

stock-summary
Return on Equity

10.56%

stock-summary
Price to Book

5.12

Revenue and Profits:
Net Sales:
2,007 Cr
(Quarterly Results - Jun 2026)
Net Profit:
86 Cr
stock-summaryTotal Returns
Total Returns (Price + Dividend) stock-summary
Dividend Yield (0%)
TimePeriod
Price Return
Dividend Return
Total Return
3 Months
-14.03%
0%
-14.03%
6 Months
-22.27%
0%
-22.27%
1 Year
-26.66%
0%
-26.66%
2 Years
-31.97%
0%
-31.97%
3 Years
0%
0%
0.0%
4 Years
0%
0%
0.0%
5 Years
0%
0%
0.0%

Go Digit General for the last several years.

Risk Adjusted Returns v/s stock-summary
Returns Beta
Icon
Beta has not been calculated since enough price history is not available
stock-summaryNews & Corporate Actions

Announcements stock-summary

Announcement under Regulation 30 (LODR)-Analyst / Investor Meet - Intimation

21-Aug-2026 | Source : BSE

Intimation under Regulation 30 of the SEBI Listing Regulations regarding schedule of the Analysts / Institutional Investors meets

Shareholder Meeting / Postal Ballot-Scrutinizers Report

20-Aug-2026 | Source : BSE

Scrutinizers Report and voting results of 10th Annual General Meeting held on 18th August 2026.

Shareholder Meeting / Postal Ballot-Outcome of AGM

18-Aug-2026 | Source : BSE

Summary of proceedings of the 10th Annual General Meeting of the Company held on 18th August 2026

Corporate Actions stock-summary

stock-summary
BOARD MEETING

No Upcoming Board Meetings

stock-summary
DIVIDEND

No Dividend history available

stock-summary
SPLITS

No Splits history available

stock-summary
BONUS

No Bonus history available

stock-summary
RIGHTS

No Rights history available

stock-summaryKey Factors

Quality key factors stock-summary

Factor
Value
Sales Growth (5y)
9.19%
EBIT Growth (5y)
61.61%
Net Debt to Equity (avg)
0.08
Institutional Holding
23.24%
ROE (avg)
10.47%

Valuation key factors

Factor
Value
P/E Ratio
49
Industry P/E
21
Price to Book Value
5.14
EV to EBIT
211.24
EV to EBITDA
211.24
EV to Capital Employed
5.03
EV to Sales
2.37
PEG Ratio
7.58
Dividend Yield
NA
ROCE (Latest)
3.32%
ROE (Latest)
10.56%

Technicals key factors

Indicator
Weekly
Monthly
MACD
Bearish
RSI
Bullish
No Signal
Bollinger Bands
Bearish
Mildly Bearish
Moving Averages
Bearish (Daily)
KST
Bearish
Dow Theory
Mildly Bullish
No Trend
OBV
No Trend
No Trend
stock-summary Technical Indicator Scale: Bearish, Mildly Bearish, Sideways, Mildly Bullish, Bullish  Turned 
stock-summaryShareholding
Shareholding Snapshot : Jun 2026stock-summary
Shareholding Compare (%holding) stock-summary
Majority shareholders

Promoters

Pledged Promoter Holdings

None

Mutual Funds

Held by 22 Schemes (8.86%)

FIIs

Held by 101 FIIs (8.23%)

Promoter with highest holding

Go Digit Infoworks Services Private Limited (72.98%)

Highest Public shareholder

Mirae Asset Large & Midcap Fund (4.76%)

Individual Investors Holdings

2.45%

stock-summaryFinancial
[
  {
    "link": "quarterly",
    "btn_text": "All Quarterly Results",
    "header": "Quarterly Results Snapshot (Standalone) - Jun'26 - QoQ",
    "rhs": [
      {
        "prefix": "Net Sales ",
        "suffix": "QoQ Growth in quarter ended Jun 2026 is -12.78% vs 6.52% in Mar 2026",
        "dir": -1
      },
      {
        "prefix": "Standalone Net Profit ",
        "suffix": "QoQ Growth in quarter ended Jun 2026 is -42.18% vs 6.66% in Mar 2026",
        "dir": -1
      }
    ],
    "table": {
      "header": [
        "Jun'26",
        "Mar'26",
        "Change(%)"
      ],
      "body": [
        {
          "field": "Net Sales",
          "val1": "2,006.96",
          "val2": "2,301.02",
          "chgp": "-12.78%",
          "chgp_class": "negative"
        },
        {
          "field": "Operating Profit (PBDIT) excl Other Income",
          "val1": "114.49",
          "val2": "-297.43",
          "chgp": "138.49%",
          "chgp_class": "positive"
        },
        {
          "field": "Interest",
          "val1": "0.00",
          "val2": "0.00",
          "chgp": "",
          "chgp_class": "neutral"
        },
        {
          "field": "Exceptional Items",
          "val1": "0.00",
          "val2": "0.00",
          "chgp": "",
          "chgp_class": "neutral"
        },
        {
          "field": "Standalone Net Profit",
          "val1": "86.39",
          "val2": "149.42",
          "chgp": "-42.18%",
          "chgp_class": "negative"
        },
        {
          "field": "Operating Profit Margin (Excl OI)",
          "val1": "5.70%",
          "val2": "-12.93%",
          "chgp": "18.63%",
          "chgp_class": "positive"
        }
      ]
    }
  },
  {
    "link": "half-yearly",
    "btn_text": "All Half Yearly Results",
    "header": "Half Yearly Results Snapshot (Standalone) - Sep'25",
    "rhs": [
      {
        "prefix": "Net Sales ",
        "suffix": " Growth in half year ended Sep 2025 is 6.41% vs 18.60% in Sep 2024",
        "dir": -1
      },
      {
        "prefix": "Standalone Net Profit ",
        "suffix": " Growth in half year ended Sep 2025 is 55.26% vs 121.49% in Sep 2024",
        "dir": -1
      }
    ],
    "table": {
      "header": [
        "Sep'25",
        "Sep'24",
        "Change(%)"
      ],
      "body": [
        {
          "field": "Net Sales",
          "val1": "3,953.21",
          "val2": "3,714.95",
          "chgp": "6.41%",
          "chgp_class": "positive"
        },
        {
          "field": "Operating Profit (PBDIT) excl Other Income",
          "val1": "294.26",
          "val2": "190.67",
          "chgp": "54.33%",
          "chgp_class": "positive"
        },
        {
          "field": "Interest",
          "val1": "0.00",
          "val2": "0.00",
          "chgp": "",
          "chgp_class": "neutral"
        },
        {
          "field": "Exceptional Items",
          "val1": "0.00",
          "val2": "0.00",
          "chgp": "",
          "chgp_class": "neutral"
        },
        {
          "field": "Standalone Net Profit",
          "val1": "296.26",
          "val2": "190.81",
          "chgp": "55.26%",
          "chgp_class": "positive"
        },
        {
          "field": "Operating Profit Margin (Excl OI)",
          "val1": "7.44%",
          "val2": "5.13%",
          "chgp": "2.31%",
          "chgp_class": "positive"
        }
      ]
    }
  },
  {
    "link": "nine-monthly",
    "btn_text": "All Nine Monthly Results",
    "header": "Nine Monthly Results Snapshot (Standalone) - Dec'25",
    "rhs": [
      {
        "prefix": "Net Sales ",
        "suffix": "YoY Growth in nine months ended Dec 2025 is 5.42% vs 13.38% in Dec 2024",
        "dir": -1
      },
      {
        "prefix": "Standalone Net Profit ",
        "suffix": "YoY Growth in nine months ended Dec 2025 is 41.06% vs 139.75% in Dec 2024",
        "dir": -1
      }
    ],
    "table": {
      "header": [
        "Dec'25",
        "Dec'24",
        "Change(%)"
      ],
      "body": [
        {
          "field": "Net Sales",
          "val1": "6,113.32",
          "val2": "5,799.09",
          "chgp": "5.42%",
          "chgp_class": "positive"
        },
        {
          "field": "Operating Profit (PBDIT) excl Other Income",
          "val1": "456.54",
          "val2": "309.12",
          "chgp": "47.69%",
          "chgp_class": "positive"
        },
        {
          "field": "Interest",
          "val1": "0.00",
          "val2": "0.00",
          "chgp": "",
          "chgp_class": "neutral"
        },
        {
          "field": "Exceptional Items",
          "val1": "0.00",
          "val2": "0.00",
          "chgp": "",
          "chgp_class": "neutral"
        },
        {
          "field": "Standalone Net Profit",
          "val1": "436.35",
          "val2": "309.33",
          "chgp": "41.06%",
          "chgp_class": "positive"
        },
        {
          "field": "Operating Profit Margin (Excl OI)",
          "val1": "6.26%",
          "val2": "4.56%",
          "chgp": "1.70%",
          "chgp_class": "positive"
        }
      ]
    }
  },
  {
    "link": "annual",
    "btn_text": "All Annual Results",
    "header": "Annual Results Snapshot (Standalone) - Mar'26",
    "rhs": [
      {
        "prefix": "Net Sales ",
        "suffix": "YoY Growth in year ended Mar 2026 is 4.58% vs 13.38% in Mar 2025",
        "dir": -1
      },
      {
        "prefix": "Standalone Net Profit ",
        "suffix": "YoY Growth in year ended Mar 2026 is 28.10% vs 133.89% in Mar 2025",
        "dir": -1
      }
    ],
    "table": {
      "header": [
        "Mar'26",
        "Mar'25",
        "Change(%)"
      ],
      "body": [
        {
          "field": "Net Sales",
          "val1": "8,414.34",
          "val2": "8,045.96",
          "chgp": "4.58%",
          "chgp_class": "positive"
        },
        {
          "field": "Operating Profit (PBDIT) excl Other Income",
          "val1": "159.11",
          "val2": "98.96",
          "chgp": "60.78%",
          "chgp_class": "positive"
        },
        {
          "field": "Interest",
          "val1": "0.00",
          "val2": "0.00",
          "chgp": "",
          "chgp_class": "neutral"
        },
        {
          "field": "Exceptional Items",
          "val1": "0.00",
          "val2": "0.00",
          "chgp": "",
          "chgp_class": "neutral"
        },
        {
          "field": "Standalone Net Profit",
          "val1": "544.35",
          "val2": "424.94",
          "chgp": "28.10%",
          "chgp_class": "positive"
        },
        {
          "field": "Operating Profit Margin (Excl OI)",
          "val1": "1.89%",
          "val2": "1.23%",
          "chgp": "0.66%",
          "chgp_class": "positive"
        }
      ]
    }
  }
]

Quarterly Results Snapshot (Standalone) - Jun'26 - QoQstock-summary

Jun'26
Mar'26
Change(%)
Net Sales
2,006.96
2,301.02
-12.78%
Operating Profit (PBDIT) excl Other Income
114.49
-297.43
138.49%
Interest
0.00
0.00
Exceptional Items
0.00
0.00
Standalone Net Profit
86.39
149.42
-42.18%
Operating Profit Margin (Excl OI)
5.70%
-12.93%
18.63%
Values in Rs Cr.
Direction Arrows
Net Sales

QoQ Growth in quarter ended Jun 2026 is -12.78% vs 6.52% in Mar 2026

Direction Arrows
Standalone Net Profit

QoQ Growth in quarter ended Jun 2026 is -42.18% vs 6.66% in Mar 2026

Half Yearly Results Snapshot (Standalone) - Sep'25stock-summary

Sep'25
Sep'24
Change(%)
Net Sales
3,953.21
3,714.95
6.41%
Operating Profit (PBDIT) excl Other Income
294.26
190.67
54.33%
Interest
0.00
0.00
Exceptional Items
0.00
0.00
Standalone Net Profit
296.26
190.81
55.26%
Operating Profit Margin (Excl OI)
7.44%
5.13%
2.31%
Values in Rs Cr.
Direction Arrows
Net Sales

Growth in half year ended Sep 2025 is 6.41% vs 18.60% in Sep 2024

Direction Arrows
Standalone Net Profit

Growth in half year ended Sep 2025 is 55.26% vs 121.49% in Sep 2024

Nine Monthly Results Snapshot (Standalone) - Dec'25stock-summary

Dec'25
Dec'24
Change(%)
Net Sales
6,113.32
5,799.09
5.42%
Operating Profit (PBDIT) excl Other Income
456.54
309.12
47.69%
Interest
0.00
0.00
Exceptional Items
0.00
0.00
Standalone Net Profit
436.35
309.33
41.06%
Operating Profit Margin (Excl OI)
6.26%
4.56%
1.70%
Values in Rs Cr.
Direction Arrows
Net Sales

YoY Growth in nine months ended Dec 2025 is 5.42% vs 13.38% in Dec 2024

Direction Arrows
Standalone Net Profit

YoY Growth in nine months ended Dec 2025 is 41.06% vs 139.75% in Dec 2024

Annual Results Snapshot (Standalone) - Mar'26stock-summary

Mar'26
Mar'25
Change(%)
Net Sales
8,414.34
8,045.96
4.58%
Operating Profit (PBDIT) excl Other Income
159.11
98.96
60.78%
Interest
0.00
0.00
Exceptional Items
0.00
0.00
Standalone Net Profit
544.35
424.94
28.10%
Operating Profit Margin (Excl OI)
1.89%
1.23%
0.66%
Values in Rs Cr.
Direction Arrows
Net Sales

YoY Growth in year ended Mar 2026 is 4.58% vs 13.38% in Mar 2025

Direction Arrows
Standalone Net Profit

YoY Growth in year ended Mar 2026 is 28.10% vs 133.89% in Mar 2025

stock-summaryCompany CV
About Go Digit General Insurance Ltd stock-summary
stock-summary
Go Digit General Insurance Ltd
Small Cap
Insurance
Go Digit General Insurance Limited (GDGIL) was incorporated as `Oben General Insurance Limited' at Pune, Maharashtra on December 7, 2016 with the Registrar of Companies. Subsequently, name of the Company was changed to `Go Digit General Insurance Limited', and a fresh Certificate of Incorporation was issued by the ROC on June 12, 2017. The Company is a subsidiary of Go Digit Infoworks Services Private Limited (GDISPL). GDGIL is promoted by Kamesh Goyal and FAL Corporation.
Company Coordinates stock-summary
Icon
No Company Details Available