
Compare Goa Carbon with Similar Stocks
Stock DNA
Minerals & Mining
INR 376 Cr (Micro Cap)
NA (Loss Making)
37
0.00%
1.01
-25.64%
1.96
Total Returns (Price + Dividend) 
Latest dividend: 10 per share ex-dividend date: Sep-03-2024
Risk Adjusted Returns v/s
Returns Beta

News
Goa Carbon Ltd Downgraded to Sell Amid Mixed Financial and Technical Signals
Goa Carbon Ltd, a micro-cap player in the Minerals & Mining sector, has seen its investment rating downgraded from Hold to Sell as of 22 June 2026. This shift reflects a complex interplay of deteriorating financial trends, challenging valuation metrics, and a weakening technical outlook, despite some recent positive quarterly results. Investors are advised to carefully consider these factors amid the company’s underperformance relative to broader market indices.
Read full news article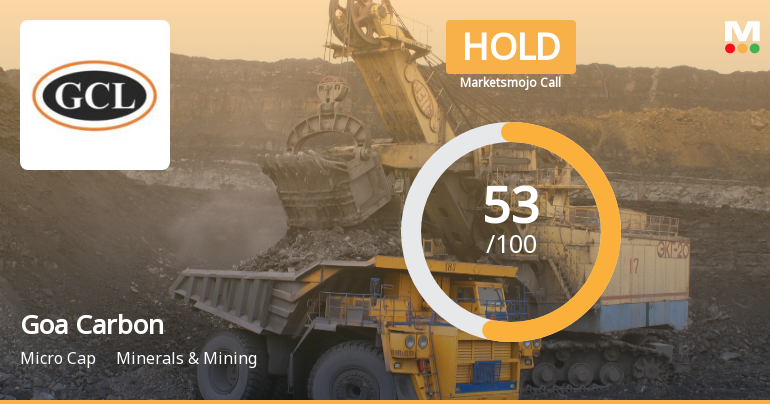
Goa Carbon Ltd Upgraded to Hold as Technicals Improve Amid Mixed Financials
Goa Carbon Ltd, a micro-cap player in the Minerals & Mining sector, has seen its investment rating upgraded from Sell to Hold as of 17 June 2026. This change reflects a nuanced improvement across technical indicators and recent financial performance, despite lingering concerns over long-term growth and profitability. The company’s stock price has shown modest gains, supported by a shift in technical trends and a positive quarterly earnings report after a prolonged period of underperformance.
Read full news article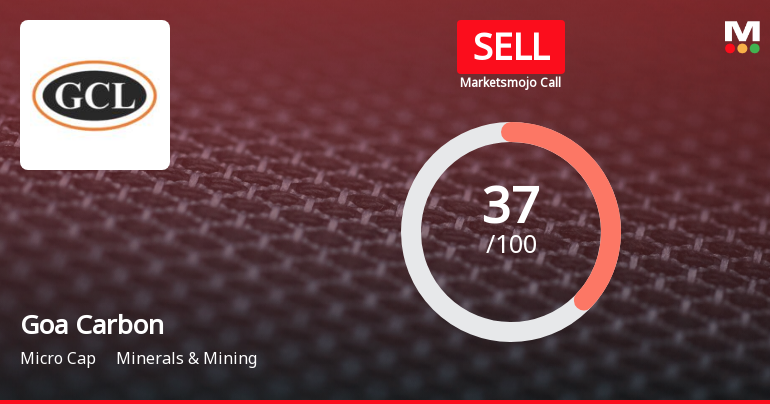
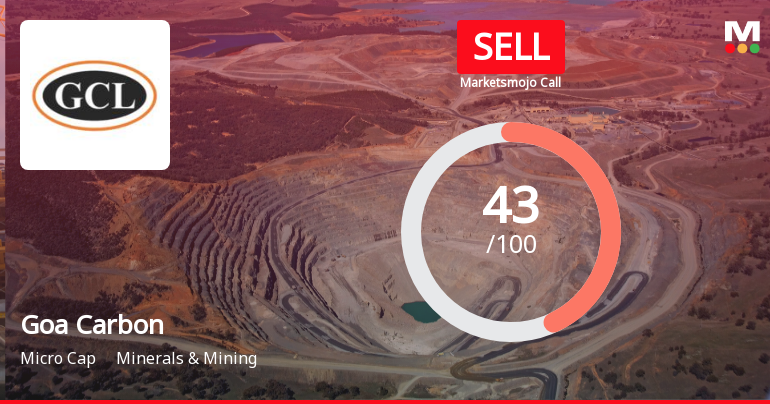
Goa Carbon Ltd is Rated Sell by MarketsMOJO
Goa Carbon Ltd is rated Sell by MarketsMOJO, with this rating last updated on 07 May 2026. However, the analysis and financial metrics discussed here reflect the company’s current position as of 10 June 2026, providing investors with the latest insights into its performance and outlook.
Read full news article Announcements
Closure of Trading Window
18-Jun-2026 | Source : BSEGoa Carbon Limited has informed the Exchange regarding the Trading Window closure pursuant to SEBI (Prohibition of Insider Trading) Regulations 2015.
Announcement Under Regulation 30 (LODR)-Updates (Resumption Of Operations At The Companys Paradeep Plant)
15-Jun-2026 | Source : BSEGoa Carbon Limited has informed the Exchange regarding the resumption of operations at the Companys Paradeep Plant.
Announcement under Regulation 30 (LODR)-Newspaper Publication
11-Jun-2026 | Source : BSEGoa Carbon Limited has informed the Exchange about copy of the Newspaper Publication.
Corporate Actions

No Upcoming Board Meetings

Goa Carbon Ltd has declared 100% dividend, ex-date: 03 Sep 24

No Splits history available

No Bonus history available

Goa Carbon Ltd has announced 1:1 rights issue, ex-date: 20 Mar 06
Quality key factors
Valuation key factors
Technicals key factors
 Technical Indicator Scale: Bearish, Mildly Bearish, Sideways, Mildly Bullish, Bullish Turned
 Shareholding Snapshot : Mar 2026
Shareholding Compare (%holding)
Promoters
None
Held by 0 Schemes
Held by 2 FIIs (0.03%)
V S Dempo Holdings Private Limited (55.39%)
None
35.21%
Quarterly Results Snapshot (Standalone) - Mar'26 - QoQ

QoQ Growth in quarter ended Mar 2026 is 3.94% vs 88.94% in Dec 2025

QoQ Growth in quarter ended Mar 2026 is 119.21% vs -9.15% in Dec 2025
Half Yearly Results Snapshot (Standalone) - Sep'25
Growth in half year ended Sep 2025 is 22.35% vs -59.34% in Sep 2024
Growth in half year ended Sep 2025 is -311.20% vs -117.18% in Sep 2024
Nine Monthly Results Snapshot (Standalone) - Dec'25
YoY Growth in nine months ended Dec 2025 is 31.68% vs -57.21% in Dec 2024
YoY Growth in nine months ended Dec 2025 is -240.63% vs -120.33% in Dec 2024
Annual Results Snapshot (Standalone) - Mar'26
YoY Growth in year ended Mar 2026 is 37.02% vs -51.93% in Mar 2025
YoY Growth in year ended Mar 2026 is -118.93% vs -125.77% in Mar 2025
About Goa Carbon Ltd

Company Coordinates


