GOCL Corpn.

  • Market Cap: Micro Cap
  • Industry: Other Chemical products
  • ISIN: INE077F01035
  • NSEID: GOCLCORP
  • BSEID: 506480
INR
446.10
-10.05 (-2.2%)
BSENSE

Sep 18, 03:30 PM

BSE+NSE Vol: 5.88 lacs

  • Price Points
  • Score
  • Mojo Parameters
  • Total Return
  • News and Corporate Actions
  • Key factors
  • Shareholding
  • Financials
  • CompanyCV
stock-summaryPrice Point
High/Low

1Day

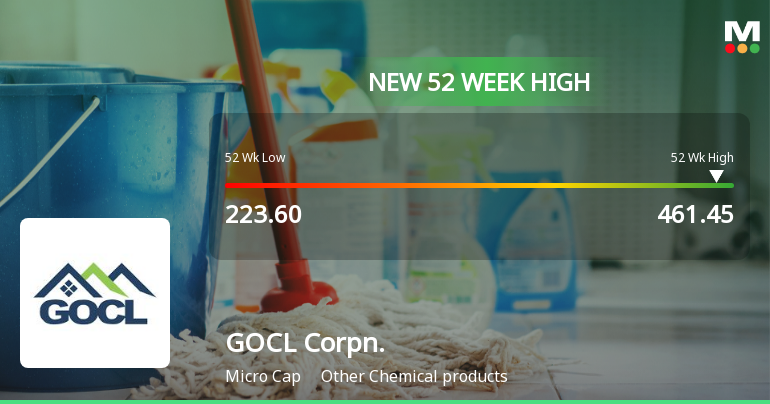
52 Week

Valuation
Technical
Day's Volume

CASH

5.88 lacs (20.40%) Volume

Shareholding (Jun 2026)

FII

5.34%

Held by 16 FIIs

DII

1.64%

Held by 2 DIIs

Promoter

67.82%

Why is GOCL Corporation Ltd falling/rising?

06-Sep-2026

As of 05-Sep, GOCL Corporation Ltd's stock price is rising to 427.60, reflecting a 1.0% increase. This growth is driven by strong recent performance, significant year-to-date gains, and increased investor interest, with the stock trading above key moving averages.

As of 05-Sep, GOCL Corporation Ltd's stock price is rising, currently at 427.60, with a change of 4.25 (1.0%) upwards. This upward movement can be attributed to several factors. The stock has shown a strong performance over the past week, gaining 9.95%, while the benchmark Sensex has declined by 0.97%. Additionally, over the past month, GOCL Corporation has increased by 3.80%, contrasting with a 2.44% drop in the Sensex.<BR><BR>Year-to-date, the stock has surged by 45.84%, significantly outperforming the Sensex, which has fallen by 10.21%. Over the past year, GOCL Corporation has also shown resilience with an 18.37% increase, while the Sensex has decreased by 5.21%. <BR><BR>Today's trading activity indicates that the stock has been gaining for the last three days, with a notable rise of 11.01% during this period. The stock reached an intraday high of Rs 431.85, reflecting a 2.01% increase. Furthermore, GOCL Corporation is trading above its 5-day, 20-day, 50-day, 100-day, and 200-day moving averages, which is a positive technical indicator.<BR><BR>Investor participation has also increased, with delivery volume on September 3 rising by 2286.34% compared to the 5-day average, suggesting heightened interest in the stock. The liquidity of the stock is adequate, allowing for trades of significant size. All these factors contribute to the rising price of GOCL Corporation Ltd.

View full answer

Should I buy, sell or hold GOCL Corporation Ltd?

05-Sep-2026

Who are in the management team of GOCL Corpn.?

01-Sep-2026

The management team of GOCL Corporation includes Chairman Sudhanshu Tripathi, along with independent directors Kanchan Chitale, Debabrata Sarkar, Aditya Sapru, and Amar Chintopanth, non-executive director Gopal Raman, executive director Pankaj Kumar, and Company Secretary A. Satyanarayana. They are responsible for the company's governance and strategic direction.

The management team of GOCL Corporation includes the following individuals:<BR><BR>1. **Sudhanshu Tripathi** - Chairman (Non-Executive) & Director (Non-Independent)<BR>2. **Kanchan Chitale** - Independent Non-Executive Director<BR>3. **Debabrata Sarkar** - Independent Non-Executive Director<BR>4. **Aditya Sapru** - Independent Non-Executive Director<BR>5. **Amar Chintopanth** - Independent Non-Executive Director<BR>6. **Gopal Raman** - Non-Executive Director<BR>7. **Pankaj Kumar** - Executive Director / Whole Time Director<BR>8. **A. Satyanarayana** - Company Secretary & Compliance Officer<BR><BR>This team plays a crucial role in the governance and strategic direction of the company.

View full answer

What does GOCL Corpn. do?

01-Sep-2026

GOCL Corporation Limited, a Micro Cap company in the Other Chemical products industry, was established in 1961 and has undergone several name changes. As of June 2026, it reported net sales of 4 Cr and a net profit of 40 Cr, with a market cap of INR 1,923 Cr.

Overview:<BR>GOCL Corporation Limited operates in the Other Chemical products industry and is categorized as a Micro Cap company.<BR><BR>History:<BR>The company was originally incorporated as Indian Detonators Limited in 1961. It underwent several name changes, becoming IDL Industries Limited in 1995, Gulf Oil Corporation Limited in 2002, and finally GOCL Corporation Limited in 2015. The latest quarterly results reported net sales and net profit for June 2026.<BR><BR>Financial Snapshot:<BR>Net Sales: 4 Cr (Quarterly Results - Jun 2026) <BR>Net Profit: 40 Cr (Quarterly Results - Jun 2026) <BR>Market Cap: INR 1,923 Cr (Micro Cap)<BR><BR>Key Metrics:<BR>P/E: 7.00 <BR>Industry P/E: 13 <BR>Dividend Yield: 0.00% <BR>Debt-Equity: -0.04 <BR>Return on Equity: 14.50% <BR>Price to Book: 0.61 <BR><BR>Contact Details:<BR>Address: IDL Road, Kukatpally Hyderabad Telangana : 500072 <BR>Tel: 91-40-23810671-9 <BR>Email: secretarial@goclcorp.com <BR>Website: http://www.goclcorp.com

View full answer

Who are the peers of the GOCL Corpn.?

01-Sep-2026

GOCL Corpn.'s peers include Ellen.Indl.Gas, Refex Industries, Prem. Explosives, Stallion India, Keltech Energies, Beezaasan Exp., DIC India, and Monolithisch Ind. In terms of performance, Keltech Energies leads with a 1-year return of 219.24%, while GOCL Corpn. has a return of 10.07%.

Peers: The peers of GOCL Corpn. are Ellen.Indl.Gas, Refex Industries, Prem. Explosives, Stallion India, Keltech Energies, Beezaasan Exp., DIC India, and Monolithisch Ind.<BR><BR>Quality Snapshot: Excellent management risk is observed at Ellen.Indl.Gas, Stallion India, and Keltech Energies, while Average management risk is found at Refex Industries, Prem. Explosives, Beezaasan Exp., DIC India, and Monolithisch Ind. Below Average management risk is noted for Stallion India. Growth is Excellent at Refex Industries and Monolithisch Ind, Good at Stallion India and Keltech Energies, Average at Ellen.Indl.Gas, and Below Average at Prem. Explosives, Beezaasan Exp., DIC India, and GOCL Corpn. Capital Structure is Excellent at Ellen.Indl.Gas, Stallion India, and Beezaasan Exp., Good at Refex Industries and Keltech Energies, and Below Average at GOCL Corpn.<BR><BR>Return Snapshot: The peer with the highest 1-year return is Keltech Energies at 219.24%, while the lowest is Ellen.Indl.Gas at -37.69%. GOCL Corpn.'s 1-year return is 10.07%, which is higher than Ellen.Indl.Gas but lower than Keltech Energies. Additionally, the peers with negative six-month returns are DIC India and Refex Industries.

View full answer

How big is GOCL Corpn.?

01-Sep-2026

As of 31st August, GOCL Corporation Ltd has a market capitalization of 1,923.00 Cr, with recent net sales of 10.66 Cr and a net profit of 339.85 Cr. Shareholder's funds are 1,576.40 Cr and total assets amount to 3,098.34 Cr as of March 2025.

As of 31st August, GOCL Corporation Ltd has a market capitalization of 1,923.00 Cr, categorizing it as a Micro Cap company.<BR><BR>In the latest 4 quarters, the company reported Net Sales of 10.66 Cr and a Net Profit of 339.85 Cr.<BR><BR>The latest annual period for the balance sheet is March 2025, with Shareholder's Funds amounting to 1,576.40 Cr and Total Assets of 3,098.34 Cr.

View full answer

Are GOCL Corporation Ltd latest results good or bad?

02-Jun-2026

GOCL Corporation Ltd's latest results are concerning, showing a net profit increase year-on-year but a significant quarterly decline, low net sales, and a deeply negative operating margin. The company's heavy reliance on other income raises questions about the sustainability of its core operations, indicating substantial risks for investors.

GOCL Corporation Ltd's latest results indicate a troubling financial situation. In Q4 FY26, the company reported a consolidated net profit of ₹75.15 crores, which, while showing a significant year-on-year increase of 225.04%, represents a drastic decline of 64.26% compared to the previous quarter. This sharp drop raises concerns about the sustainability of its profitability.<BR><BR>The net sales for the quarter were only ₹2.33 crores, reflecting a 28.02% increase from the previous quarter but a concerning 21.81% decrease year-on-year. This level of sales is alarmingly low, suggesting that the company's core chemical products business is struggling to maintain meaningful operations.<BR><BR>Moreover, the operating margin was deeply negative at -348.5%, indicating that the company is incurring substantial losses relative to its revenue. The operating loss before other income stood at ₹8.12 crores, highlighting severe operational challenges.<BR><BR>A critical aspect of GOCL's financial performance is its heavy reliance on other income, which amounted to ₹76.27 crores in Q4 FY26, overshadowing its sales revenue. This dependency raises significant questions about the viability of its core business operations.<BR><BR>Overall, while there are some positive year-on-year comparisons, the overall picture is one of operational distress and a lack of a clear turnaround strategy. Investors should approach with caution, as the company's fundamentals indicate significant risks and uncertainties.

View full answer

When is the next results date for GOCL Corporation Ltd?

20-May-2026

The next results date for GOCL Corporation Ltd is 29 May 2026.

The next results date for GOCL Corporation Ltd is scheduled for 29 May 2026.

View full answer

Is GOCL Corpn. technically bullish or bearish?

14-Nov-2025

As of November 13, 2025, the technical trend is mildly bearish, indicated by mixed momentum from MACD signals, bearish Bollinger Bands, and underperformance against the Sensex, suggesting a cautious approach.

As of 13 November 2025, the technical trend has changed from sideways to mildly bearish. The current stance is mildly bearish, driven by several key indicators. The MACD on a weekly basis is mildly bearish, while the monthly MACD shows a mildly bullish signal, indicating mixed momentum. The Bollinger Bands are bearish on both weekly and monthly time frames, reinforcing the bearish outlook. The KST is mildly bearish weekly and bearish monthly, and Dow Theory also reflects a mildly bearish stance across both time frames. The moving averages indicate a mildly bullish signal on the daily chart, but this is overshadowed by the overall bearish sentiment from the weekly indicators. The stock has underperformed against the Sensex over multiple periods, particularly in the 1-month and year-to-date comparisons. Overall, the technical indicators suggest a cautious approach.

View full answer

How has been the historical performance of GOCL Corpn.?

13-Nov-2025

GOCL Corpn. has shown significant financial volatility, with net sales and operating income dropping from 920.77 Cr in Mar'23 to 18.19 Cr by Mar'25, while profit before tax improved to 144.10 Cr in Mar'25. Despite challenges, cash flow from operating activities turned positive at 15.00 Cr in Mar'25.

Answer:<BR>The historical performance of GOCL Corpn. shows significant fluctuations in key financial metrics over the years.<BR><BR>Breakdown:<BR>GOCL Corpn. has experienced considerable volatility in its net sales, which peaked at 920.77 Cr in Mar'23 but plummeted to just 18.19 Cr by Mar'25. The total operating income followed a similar trend, decreasing from 920.77 Cr in Mar'23 to 18.19 Cr in Mar'25. The company's operating profit (PBDIT) also saw a decline, moving from a profit of 468.09 Cr in Mar'23 to a loss of 259.06 Cr in Mar'25. Despite this, the profit before tax improved to 144.10 Cr in Mar'25, up from 59.47 Cr in Mar'24, while profit after tax rose to 106.52 Cr in Mar'25 from 44.85 Cr in Mar'24. The total liabilities increased from 2,887.27 Cr in Mar'24 to 3,098.34 Cr in Mar'25, with total assets also rising to 3,098.34 Cr in Mar'25. Cash flow from operating activities turned positive at 15.00 Cr in Mar'25, contrasting with a negative cash flow of -76.00 Cr in Mar'23. Overall, the company's financial performance reflects a challenging environment with significant shifts in revenue and profitability.

View full answer

Is GOCL Corpn. overvalued or undervalued?

09-Jun-2025

As of February 14, 2024, GOCL Corporation is considered overvalued and has shifted from a fair to risky valuation grade due to concerning financial ratios, including a PE ratio of 17.86, a negative EV to EBITDA of -60.78, and a one-year return of -6.78% compared to the Sensex's 7.61%.

As of 14 February 2024, the valuation grade for GOCL Corporation has moved from fair to risky, indicating a shift in perception regarding its financial health. The company appears to be overvalued based on several key ratios, including a PE ratio of 17.86, a Price to Book Value of 0.99, and an EV to EBITDA of -60.78. These figures suggest that despite a relatively low Price to Book Value, the negative EV to EBITDA indicates significant concerns about profitability and operational efficiency.<BR><BR>In comparison to peers, GOCL Corporation's ratios are concerning, especially when contrasted with industry standards. For instance, while the PE ratio is comparable to some peers, the negative EV to EBITDA highlights a critical divergence in performance. Notably, the company's ROCE stands at -2.26%, further emphasizing operational challenges. Recent stock performance shows that while GOCL has outperformed the Sensex over the past week and month, its one-year return of -6.78% relative to the Sensex's 7.61% suggests underlying weaknesses that may not be adequately reflected in its current valuation. Overall, GOCL Corporation is deemed overvalued at this time.

View full answer

Who are the top shareholders of the GOCL Corpn.?

06-Jun-2025

The top shareholder of GOCL Corporation is Hinduja Capital Limited, holding 72.82%. Other notable shareholders include The New India Assurance Company Limited at 1.17%, individual investors with 19.0%, and 17 Foreign Institutional Investors (FIIs) with a total of 0.37%.

The top shareholders of GOCL Corporation are predominantly the promoters, with Hinduja Capital Limited holding the highest stake at 72.82%. There are no pledged promoter holdings. In terms of public shareholders, The New India Assurance Company Limited is the largest, holding 1.17%. Additionally, individual investors collectively own 19.0% of the company, while 17 Foreign Institutional Investors (FIIs) hold a total of 0.37%.

View full answer

Has GOCL Corpn. declared dividend?

06-Jun-2025

GOCL Corporation Ltd has declared a 200% dividend, amounting to ₹4 per share, with an ex-date of September 17, 2024. While the recent total returns show negative performance in the short term, the company has demonstrated positive growth over longer periods, resulting in a modest dividend yield of 1.25%.

GOCL Corporation Ltd has declared a 200% dividend.<BR><BR>Dividend Details:<BR>- Percentage announced: 200%<BR>- Amount per share: 4<BR>- Ex-date: 17 Sep 24<BR><BR>Dividend Yield: 1.25%.<BR><BR>Total Returns by Period:<BR>In the last 6 months, the price return was -23.43%, with a dividend return of 0%, resulting in a total return of -23.43%.<BR><BR>Over the past year, the price return was -18.06%, yielding a dividend return of 0.98%, leading to a total return of -17.08%.<BR><BR>In the 2-year period, the price return was 0.7%, with a dividend return of 2.88%, culminating in a total return of 3.58%.<BR><BR>For the 3-year period, the price return stood at 16.75%, while the dividend return was 5.38%, resulting in a total return of 22.13%.<BR><BR>In the last 4 years, the price return was 25.8%, with a dividend return of 5.78%, leading to a total return of 31.58%.<BR><BR>Finally, over the 5-year period, the price return was 88.5%, with a dividend return of 12.63%, resulting in a total return of 101.13%.<BR><BR>Overall, while GOCL Corporation Ltd has declared a significant dividend, the recent total returns indicate a mixed performance, with negative returns in the short term but positive growth over longer periods. The dividend yield suggests a modest return on investment relative to the stock price.

View full answer
iScoreScore
Click here to find our call on this stock
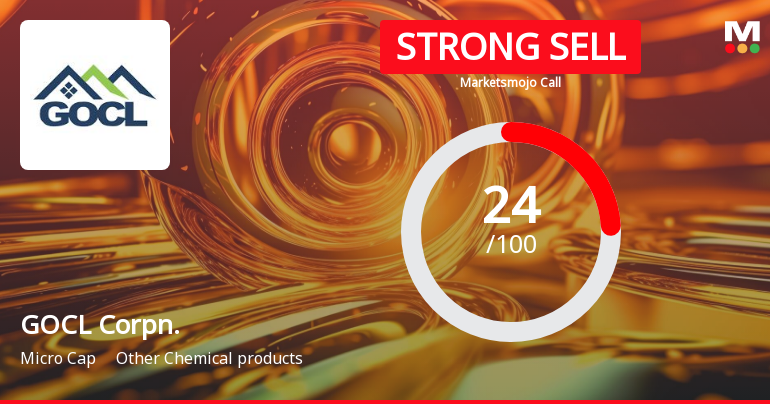
Strong Sell
Sell
Hold
Buy
Strong Buy

Dashboard

1

With a Operating Losses, the company has a Weak Long Term Fundamental Strength

  • Low ability to service debt as the company has a high Debt to EBITDA ratio of -0.02 times
  • The company has been able to generate a Return on Equity (avg) of 8.83% signifying low profitability per unit of shareholders funds
2

Negative results in Jun 26

3

Risky - Negative EBITDA

4

Despite the size of the company, domestic mutual funds hold only 0% of the company

stock-summaryMojo Parameters

Mojo Parameters

Loading Valuation Snapshot...

Stock DNA

stock-summary
Industry

Other Chemical products

stock-summary
Market cap

INR 2,239 Cr (Micro Cap)

stock-summary
P/E

8.00

stock-summary
Industry P/E

13

stock-summary
Dividend Yield

0.00%

stock-summary
Debt Equity

-0.04

stock-summary
Return on Equity

14.50%

stock-summary
Price to Book

0.72

Revenue and Profits:
Net Sales:
4 Cr
(Quarterly Results - Jun 2026)
Net Profit:
40 Cr
stock-summaryTotal Returns
Total Returns (Price + Dividend) stock-summary
Dividend Yield (0%)
TimePeriod
Price Return
Dividend Return
Total Return
3 Months
4.98%
6.74%
11.72%
6 Months
84.0%
13.33%
97.33%
1 Year
22.84%
8.35%
31.19%
2 Years
4.25%
9.50%
13.75%
3 Years
5.1%
8.92%
14.02%
4 Years
56.91%
17.96%
74.87%
5 Years
67.3%
14.56%
81.86%

Latest dividend: 10 per share ex-dividend date: Jul-25-2025

Risk Adjusted Returns v/s stock-summary
Returns Beta
Icon
Beta has not been calculated since enough price history is not available
stock-summaryNews & Corporate Actions

News

GOCL Corporation Ltd Gains 0.63%: 3 Key Factors Driving the Week’s Momentum

Announcements stock-summary

GOCL Corporation Limited - Other General Purpose

28-Nov-2019 | Source : NSE

GOCL Corporation Limited has informed the Exchange regarding Disclosure of Related Party Transactions on consolidated basis for the half year ended September 30, 2019

GOCL Corporation Limited - Outcome of Board Meeting

08-Nov-2019 | Source : NSE

GOCL Corporation Limited has informed the Exchange regarding Board meeting held on November 07, 2019.

GOCL Corporation Limited - Credit Rating

29-Oct-2019 | Source : NSE

GOCL Corporation Limited has informed the Exchange regarding Credit Rating- Revision in the Credit Rating in respect of the Company and IDL Explosives Limited, a wholly owned subsidiary of the Company

Corporate Actions stock-summary

stock-summary
BOARD MEETING

No Upcoming Board Meetings

stock-summary
DIVIDEND

GOCL Corporation Ltd has declared 1500% dividend, ex-date: 22 Sep 26

stock-summary
SPLITS

GOCL Corporation Ltd has announced 2:10 stock split, ex-date: 26 Oct 07

stock-summary
BONUS

No Bonus history available

stock-summary
RIGHTS

GOCL Corporation Ltd has announced 1:3 rights issue, ex-date: 27 Jul 10

stock-summaryKey Factors

Quality key factors stock-summary

Factor
Value
Sales Growth (5y)
-52.73%
EBIT Growth (5y)
-227.03%
EBIT to Interest (avg)
-0.53
Debt to EBITDA (avg)
34.37
Net Debt to Equity (avg)
-0.04
Sales to Capital Employed (avg)
0.16
Tax Ratio
20.62%
Dividend Payout Ratio
31.53%
Pledged Shares
0
Institutional Holding
6.99%
ROCE (avg)
-0.90%
ROE (avg)
8.83%

Valuation key factors

Factor
Value
P/E Ratio
8
Industry P/E
13
Price to Book Value
0.70
EV to EBIT
-62.90
EV to EBITDA
-68.47
EV to Capital Employed
0.69
EV to Sales
196.74
PEG Ratio
NA
Dividend Yield
NA
ROCE (Latest)
-1.11%
ROE (Latest)
14.50%

Technicals key factors

Indicator
Weekly
Monthly
MACD
Bullish
Bullish
RSI
No Signal
Bearish
Bollinger Bands
Bullish
Bullish
Moving Averages
Bullish (Daily)
KST
Mildly Bearish
Mildly Bullish
Dow Theory
Mildly Bullish
Mildly Bullish
OBV
Bullish
Bullish
stock-summary Technical Indicator Scale: Bearish, Mildly Bearish, Sideways, Mildly Bullish, Bullish  Turned 
stock-summaryShareholding
Shareholding Snapshot : Jun 2026stock-summary
Shareholding Compare (%holding) stock-summary
Majority shareholders

Promoters

Pledged Promoter Holdings

None

Mutual Funds

Held by 0 Schemes

FIIs

Held by 16 FIIs (5.34%)

Promoter with highest holding

Hinduja Capital Limited (67.82%)

Highest Public shareholder

Legends Global Opportunities (singapore) Pte. Ltd. (1.79%)

Individual Investors Holdings

18.88%

stock-summaryFinancial
[
  {
    "link": "quarterly",
    "btn_text": "All Quarterly Results",
    "header": "Quarterly Results Snapshot (Consolidated) - Jun'26 - QoQ",
    "rhs": [
      {
        "prefix": "Net Sales ",
        "suffix": "QoQ Growth in quarter ended Jun 2026 is 84.12% vs 28.02% in Mar 2026",
        "dir": 1
      },
      {
        "prefix": "Consolidated Net Profit ",
        "suffix": "QoQ Growth in quarter ended Jun 2026 is -46.24% vs -64.26% in Mar 2026",
        "dir": 1
      }
    ],
    "table": {
      "header": [
        "Jun'26",
        "Mar'26",
        "Change(%)"
      ],
      "body": [
        {
          "field": "Net Sales",
          "val1": "4.29",
          "val2": "2.33",
          "chgp": "84.12%",
          "chgp_class": "positive"
        },
        {
          "field": "Operating Profit (PBDIT) excl Other Income",
          "val1": "-5.25",
          "val2": "-8.12",
          "chgp": "35.34%",
          "chgp_class": "positive"
        },
        {
          "field": "Interest",
          "val1": "0.00",
          "val2": "3.85",
          "chgp": "-100.00%",
          "chgp_class": "positive"
        },
        {
          "field": "Exceptional Items",
          "val1": "0.07",
          "val2": "33.12",
          "chgp": "-99.79%",
          "chgp_class": "negative"
        },
        {
          "field": "Consolidate Net Profit",
          "val1": "40.40",
          "val2": "75.15",
          "chgp": "-46.24%",
          "chgp_class": "negative"
        },
        {
          "field": "Operating Profit Margin (Excl OI)",
          "val1": "-122.38%",
          "val2": "-348.50%",
          "chgp": "226.12%",
          "chgp_class": "positive"
        }
      ]
    }
  },
  {
    "link": "half-yearly",
    "btn_text": "All Half Yearly Results",
    "header": "Half Yearly Results Snapshot (Consolidated) - Sep'25",
    "rhs": [
      {
        "prefix": "Net Sales ",
        "suffix": " Growth in half year ended Sep 2025 is -22.94% vs -97.98% in Sep 2024",
        "dir": 1
      },
      {
        "prefix": "Consolidated Net Profit ",
        "suffix": " Growth in half year ended Sep 2025 is 2,866.13% vs 49.53% in Sep 2024",
        "dir": 1
      }
    ],
    "table": {
      "header": [
        "Sep'25",
        "Sep'24",
        "Change(%)"
      ],
      "body": [
        {
          "field": "Net Sales",
          "val1": "5.61",
          "val2": "7.28",
          "chgp": "-22.94%",
          "chgp_class": "negative"
        },
        {
          "field": "Operating Profit (PBDIT) excl Other Income",
          "val1": "-13.27",
          "val2": "-18.45",
          "chgp": "28.08%",
          "chgp_class": "positive"
        },
        {
          "field": "Interest",
          "val1": "37.94",
          "val2": "54.19",
          "chgp": "-29.99%",
          "chgp_class": "positive"
        },
        {
          "field": "Exceptional Items",
          "val1": "1,171.76",
          "val2": "-24.66",
          "chgp": "4,851.66%",
          "chgp_class": "positive"
        },
        {
          "field": "Consolidate Net Profit",
          "val1": "1,236.58",
          "val2": "41.69",
          "chgp": "2,866.13%",
          "chgp_class": "positive"
        },
        {
          "field": "Operating Profit Margin (Excl OI)",
          "val1": "-236.54%",
          "val2": "-253.43%",
          "chgp": "16.89%",
          "chgp_class": "positive"
        }
      ]
    }
  },
  {
    "link": "nine-monthly",
    "btn_text": "All Nine Monthly Results",
    "header": "Nine Monthly Results Snapshot (Consolidated) - Dec'25",
    "rhs": [
      {
        "prefix": "Net Sales ",
        "suffix": "YoY Growth in nine months ended Dec 2025 is -37.41% vs -97.75% in Dec 2024",
        "dir": 1
      },
      {
        "prefix": "Consolidated Net Profit ",
        "suffix": "YoY Growth in nine months ended Dec 2025 is 979.01% vs 209.53% in Dec 2024",
        "dir": 1
      }
    ],
    "table": {
      "header": [
        "Dec'25",
        "Dec'24",
        "Change(%)"
      ],
      "body": [
        {
          "field": "Net Sales",
          "val1": "7.43",
          "val2": "11.87",
          "chgp": "-37.41%",
          "chgp_class": "negative"
        },
        {
          "field": "Operating Profit (PBDIT) excl Other Income",
          "val1": "-23.27",
          "val2": "-25.92",
          "chgp": "10.22%",
          "chgp_class": "positive"
        },
        {
          "field": "Interest",
          "val1": "44.70",
          "val2": "78.75",
          "chgp": "-43.24%",
          "chgp_class": "positive"
        },
        {
          "field": "Exceptional Items",
          "val1": "1,222.28",
          "val2": "36.41",
          "chgp": "3,256.99%",
          "chgp_class": "positive"
        },
        {
          "field": "Consolidate Net Profit",
          "val1": "1,446.85",
          "val2": "134.09",
          "chgp": "979.01%",
          "chgp_class": "positive"
        },
        {
          "field": "Operating Profit Margin (Excl OI)",
          "val1": "-313.19%",
          "val2": "-218.37%",
          "chgp": "-94.82%",
          "chgp_class": "negative"
        }
      ]
    }
  },
  {
    "link": "annual",
    "btn_text": "All Annual Results",
    "header": "Annual Results Snapshot (Consolidated) - Mar'26",
    "rhs": [
      {
        "prefix": "Net Sales ",
        "suffix": "YoY Growth in year ended Mar 2026 is -46.34% vs -97.02% in Mar 2025",
        "dir": 1
      },
      {
        "prefix": "Consolidated Net Profit ",
        "suffix": "YoY Growth in year ended Mar 2026 is 868.10% vs 225.82% in Mar 2025",
        "dir": 1
      }
    ],
    "table": {
      "header": [
        "Mar'26",
        "Mar'25",
        "Change(%)"
      ],
      "body": [
        {
          "field": "Net Sales",
          "val1": "9.76",
          "val2": "18.19",
          "chgp": "-46.34%",
          "chgp_class": "negative"
        },
        {
          "field": "Operating Profit (PBDIT) excl Other Income",
          "val1": "-31.39",
          "val2": "-27.62",
          "chgp": "-13.65%",
          "chgp_class": "negative"
        },
        {
          "field": "Interest",
          "val1": "48.54",
          "val2": "102.42",
          "chgp": "-52.61%",
          "chgp_class": "positive"
        },
        {
          "field": "Exceptional Items",
          "val1": "1,255.36",
          "val2": "40.39",
          "chgp": "3,008.10%",
          "chgp_class": "positive"
        },
        {
          "field": "Consolidate Net Profit",
          "val1": "1,521.95",
          "val2": "157.21",
          "chgp": "868.10%",
          "chgp_class": "positive"
        },
        {
          "field": "Operating Profit Margin (Excl OI)",
          "val1": "-321.62%",
          "val2": "-151.84%",
          "chgp": "-169.78%",
          "chgp_class": "negative"
        }
      ]
    }
  }
]

Quarterly Results Snapshot (Consolidated) - Jun'26 - QoQstock-summary

Jun'26
Mar'26
Change(%)
Net Sales
4.29
2.33
84.12%
Operating Profit (PBDIT) excl Other Income
-5.25
-8.12
35.34%
Interest
0.00
3.85
-100.00%
Exceptional Items
0.07
33.12
-99.79%
Consolidate Net Profit
40.40
75.15
-46.24%
Operating Profit Margin (Excl OI)
-122.38%
-348.50%
226.12%
Values in Rs Cr.
Direction Arrows
Net Sales

QoQ Growth in quarter ended Jun 2026 is 84.12% vs 28.02% in Mar 2026

Direction Arrows
Consolidated Net Profit

QoQ Growth in quarter ended Jun 2026 is -46.24% vs -64.26% in Mar 2026

Half Yearly Results Snapshot (Consolidated) - Sep'25stock-summary

Sep'25
Sep'24
Change(%)
Net Sales
5.61
7.28
-22.94%
Operating Profit (PBDIT) excl Other Income
-13.27
-18.45
28.08%
Interest
37.94
54.19
-29.99%
Exceptional Items
1,171.76
-24.66
4,851.66%
Consolidate Net Profit
1,236.58
41.69
2,866.13%
Operating Profit Margin (Excl OI)
-236.54%
-253.43%
16.89%
Values in Rs Cr.
Direction Arrows
Net Sales

Growth in half year ended Sep 2025 is -22.94% vs -97.98% in Sep 2024

Direction Arrows
Consolidated Net Profit

Growth in half year ended Sep 2025 is 2,866.13% vs 49.53% in Sep 2024

Nine Monthly Results Snapshot (Consolidated) - Dec'25stock-summary

Dec'25
Dec'24
Change(%)
Net Sales
7.43
11.87
-37.41%
Operating Profit (PBDIT) excl Other Income
-23.27
-25.92
10.22%
Interest
44.70
78.75
-43.24%
Exceptional Items
1,222.28
36.41
3,256.99%
Consolidate Net Profit
1,446.85
134.09
979.01%
Operating Profit Margin (Excl OI)
-313.19%
-218.37%
-94.82%
Values in Rs Cr.
Direction Arrows
Net Sales

YoY Growth in nine months ended Dec 2025 is -37.41% vs -97.75% in Dec 2024

Direction Arrows
Consolidated Net Profit

YoY Growth in nine months ended Dec 2025 is 979.01% vs 209.53% in Dec 2024

Annual Results Snapshot (Consolidated) - Mar'26stock-summary

Mar'26
Mar'25
Change(%)
Net Sales
9.76
18.19
-46.34%
Operating Profit (PBDIT) excl Other Income
-31.39
-27.62
-13.65%
Interest
48.54
102.42
-52.61%
Exceptional Items
1,255.36
40.39
3,008.10%
Consolidate Net Profit
1,521.95
157.21
868.10%
Operating Profit Margin (Excl OI)
-321.62%
-151.84%
-169.78%
Values in Rs Cr.
Direction Arrows
Net Sales

YoY Growth in year ended Mar 2026 is -46.34% vs -97.02% in Mar 2025

Direction Arrows
Consolidated Net Profit

YoY Growth in year ended Mar 2026 is 868.10% vs 225.82% in Mar 2025

stock-summaryCompany CV
About GOCL Corporation Ltd stock-summary
stock-summary
GOCL Corporation Ltd
Micro Cap
Other Chemical products
GOCL Corporation Limited, originally started its journey as Indian Detonators Limited (IDL) in year 1961, in Hyderabad. In October 1995, the Company changed their name from IDL Chemicals Limited to IDL Industries Limited and thereafter, changed to Gulf Oil Corporation Limited on August 28, 2002. Further, the Company got renamed as 'GOCL Corporation Limited' on August 10, 2015.
Company Coordinates stock-summary
Company Details
IDL Road, Kukatpally Hyderabad Telangana : 500072
stock-summary
Tel: 91-40-23810671-9
stock-summary
secretarial@goclcorp.com
Registrar Details
Karvy Computershare Pvt Ltd., Karvy Selenium, Tower-B Plot No 31 & 32, Survey No 116/22, 115/24, 115/25, Financial District, Nanakramguda, Serilingampally, Mandal Ranga Reddy Dist, Hyderabad