
Compare GOCL Corpn. with Similar Stocks
Dashboard
With a Operating Losses, the company has a Weak Long Term Fundamental Strength
- Poor long term growth as Net Sales has grown by an annual rate of -52.78% and Operating profit at -283.34% over the last 5 years
- Low ability to service debt as the company has a high Debt to EBITDA ratio of -0.02 times
Flat results in Mar 26
Risky - Negative EBITDA
Despite the size of the company, domestic mutual funds hold only 0.02% of the company
Stock DNA
Other Chemical products
INR 1,900 Cr (Small Cap)
4.00
14
2.61%
-0.04
14.50%
0.60
Total Returns (Price + Dividend) 
Latest dividend: 10 per share ex-dividend date: Jul-25-2025
Risk Adjusted Returns v/s
Returns Beta

News
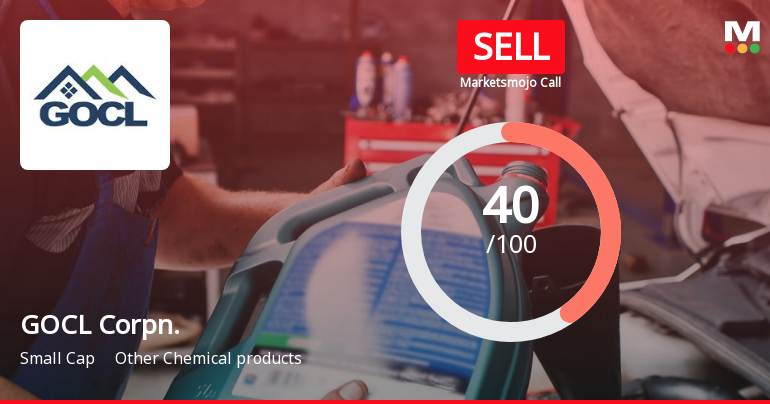
GOCL Corporation Ltd is Rated Sell
GOCL Corporation Ltd is rated 'Sell' by MarketsMOJO, with this rating last updated on 25 May 2026. However, the analysis and financial metrics discussed here reflect the stock's current position as of 08 June 2026, providing investors with the most up-to-date view of the company’s fundamentals, returns, and market standing.
Read full news article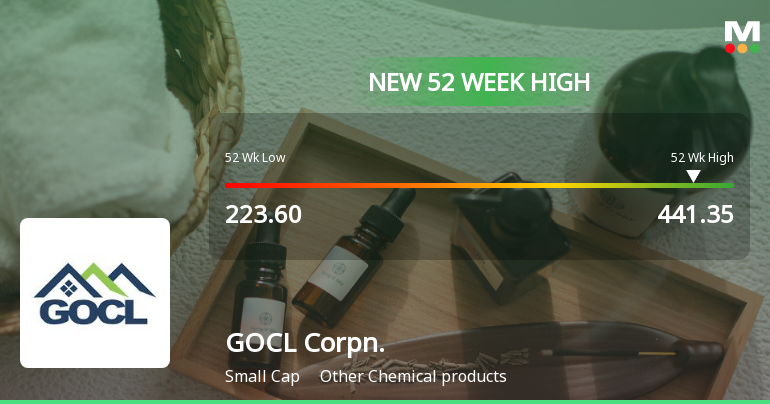
Broad-Based Technical Strength Lifts GOCL Corporation Ltd to 52-Week High of Rs 441.35
With a decisive break above Rs 441.35 on 4 Jun 2026, GOCL Corporation Ltd has reached a fresh 52-week high, marking a significant milestone in its price momentum. This surge comes amid a sustained four-day rally that has propelled the stock up by nearly 18%, outpacing its sector and the broader market.
Read full news article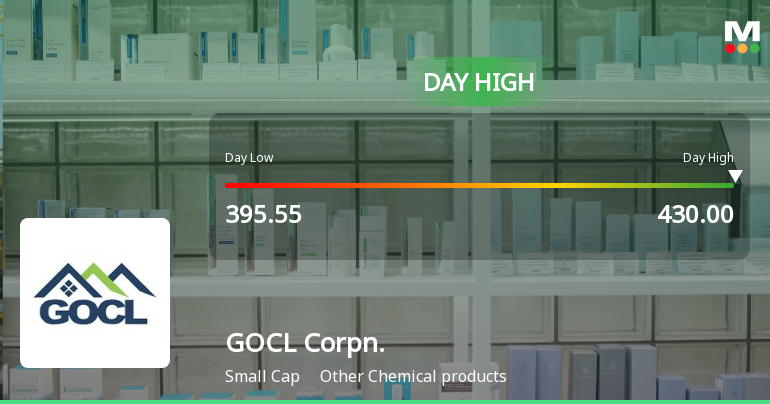
GOCL Corporation Ltd Surges 7.55% to Day's High of Rs 430 — Outperforms Sector by 5.08 Percentage Points
The Sensex declined 0.41% on 03 Jun 2026, while GOCL Corporation Ltd surged 7.55%, marking a striking 5.08-percentage-point outperformance against its sector. This sharp intraday advance to Rs 430 represents a significant technical event amid a broadly weak market backdrop.
Read full news article Announcements
Announcement under Regulation 30 (LODR)-Newspaper Publication
08-Jun-2026 | Source : BSENewspaper Publication - Postal Ballot Notice
Shareholder Meeting / Postal Ballot-Notice of Postal Ballot
05-Jun-2026 | Source : BSENotice of Postal Ballot dated May 29 2026
Board Meeting Outcome for Audited Financial Results For Quarter And Year Ended March 31 2026 And Recommendation Of Dividend
29-May-2026 | Source : BSEAudited financial results for quarter and year ended March 31 2026 and recommendation of dividend
Corporate Actions

No Upcoming Board Meetings

GOCL Corporation Ltd has declared 500% dividend, ex-date: 25 Jul 25

GOCL Corporation Ltd has announced 2:10 stock split, ex-date: 26 Oct 07

No Bonus history available

GOCL Corporation Ltd has announced 1:3 rights issue, ex-date: 27 Jul 10
Quality key factors
Valuation key factors
Technicals key factors
 Technical Indicator Scale: Bearish, Mildly Bearish, Sideways, Mildly Bullish, Bullish Turned
 Shareholding Snapshot : Mar 2026
Shareholding Compare (%holding)
Promoters
None
Held by 2 Schemes (0.01%)
Held by 10 FIIs (5.08%)
Hinduja Capital Limited (67.82%)
Legends Global Opportunities (singapore) Pte. Ltd. (1.79%)
19.32%
Quarterly Results Snapshot (Consolidated) - Mar'26 - QoQ

QoQ Growth in quarter ended Mar 2026 is 28.02% vs -18.02% in Dec 2025

QoQ Growth in quarter ended Mar 2026 is -64.26% vs 1,398.72% in Dec 2025
Half Yearly Results Snapshot (Consolidated) - Sep'25
Growth in half year ended Sep 2025 is -22.94% vs -97.98% in Sep 2024
Growth in half year ended Sep 2025 is 2,866.13% vs 49.53% in Sep 2024
Nine Monthly Results Snapshot (Consolidated) - Dec'25
YoY Growth in nine months ended Dec 2025 is -37.41% vs -97.75% in Dec 2024
YoY Growth in nine months ended Dec 2025 is 979.01% vs 209.53% in Dec 2024
Annual Results Snapshot (Consolidated) - Mar'26
YoY Growth in year ended Mar 2026 is -46.34% vs -97.02% in Mar 2025
YoY Growth in year ended Mar 2026 is 868.10% vs 225.82% in Mar 2025
About GOCL Corporation Ltd

Company Coordinates


