
Compare Godrej Industrie with Similar Stocks
Dashboard
High Debt company with Weak Long Term Fundamental Strength
- High Debt Company with a Debt to Equity ratio (avg) of 2.40 times
- The company has been able to generate a Return on Equity (avg) of 8.85% signifying low profitability per unit of shareholders funds
With a growth in Net Profit of 163.58%, the company declared Very Positive results in Mar 26
With ROCE of 3.4, it has a Attractive valuation with a 1.5 Enterprise value to Capital Employed
Majority shareholders : Promoters
Stock DNA
Diversified
INR 38,160 Cr (Mid Cap)
30.00
43
0.00%
3.59
11.53%
3.42
Total Returns (Price + Dividend) 
Latest dividend: 1.15 per share ex-dividend date: Aug-02-2019
Risk Adjusted Returns v/s
Returns Beta

News

Godrej Industries Ltd Technical Momentum Shifts to Bullish Amid Mixed Indicator Signals
Godrej Industries Ltd has witnessed a notable shift in its technical momentum, moving from a mildly bullish stance to a more confident bullish trend. This transition is underscored by a combination of technical indicators, including MACD, RSI, moving averages, and Bollinger Bands, which collectively suggest an improving price momentum despite some mixed signals on longer-term charts. Investors and analysts are now closely monitoring these developments as the stock attempts to consolidate gains and potentially extend its upward trajectory.
Read full news article
Godrej Industries Ltd Upgraded to Hold as Technicals Improve Amid Strong Financials
Godrej Industries Ltd has seen its investment rating upgraded from Sell to Hold, reflecting a notable improvement in technical indicators and robust quarterly financial performance. The upgrade, effective from 19 June 2026, is driven by positive shifts across four key parameters: quality, valuation, financial trend, and technicals, signalling a cautious but optimistic outlook for this mid-cap diversified company.
Read full news article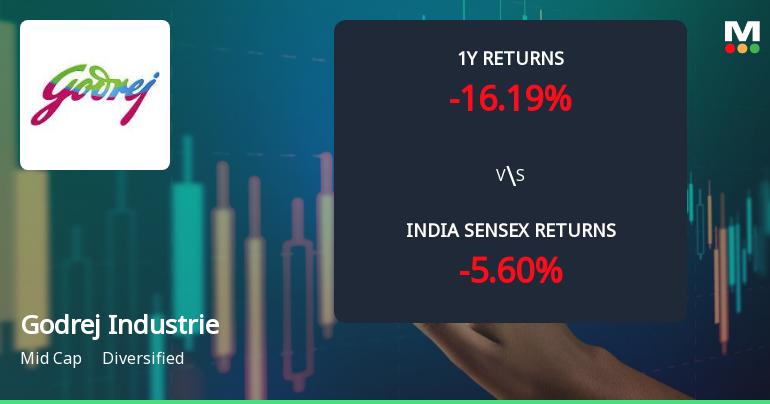
Godrej Industries Ltd Technical Momentum Shifts to Mildly Bullish Amid Mixed Indicator Signals
Godrej Industries Ltd has witnessed a notable shift in its technical momentum, moving from a mildly bearish stance to a mildly bullish trend. This change is underscored by a complex interplay of technical indicators, including MACD, RSI, moving averages, and Bollinger Bands, reflecting a nuanced market sentiment for this mid-cap diversified company.
Read full news article Announcements
Shareholder Meeting / Postal Ballot-Outcome of Postal_Ballot
23-Jun-2026 | Source : BSEPlease find attached Outcome of Postal Ballot Notice dated May 15 2026 along with Scrutinizers Report.
Completion Of Tenure Of Mr. Ajaykumar Vaghani As An Independent Director Of The Company With Effect From Close Of Business Hours On June 22 2026
22-Jun-2026 | Source : BSEPlease find enclosed intimation which is self-explanatory in nature.
Approval Of Key Information Document For Issue Up To 100000 Rated Listed Unsecured Redeemable Non-Convertible Debentures Aggregating Up To Rs. 1000 Crore On Private Placement Basis In One Or More Tranches.
18-Jun-2026 | Source : BSEPlease find enclosed intimation which is self-explanatory in nature.
Corporate Actions

No Upcoming Board Meetings

Godrej Industries Ltd has declared 115% dividend, ex-date: 02 Aug 19

Godrej Industries Ltd has announced 1:6 stock split, ex-date: 25 Aug 06

Godrej Industries Ltd has announced 1:1250 bonus issue, ex-date: 05 Jan 15

No Rights history available
Quality key factors
Valuation key factors
Technicals key factors
 Technical Indicator Scale: Bearish, Mildly Bearish, Sideways, Mildly Bullish, Bullish Turned
 Shareholding Snapshot : Mar 2026
Shareholding Compare (%holding)
Promoters
5.0556
Held by 23 Schemes (2.81%)
Held by 107 FIIs (4.47%)
Nadir Godrej (16.91%)
Vivek Gambhir, Hiten Kotak & Neera Nundy (trustees-godrej Foundation) (adi Godrej- Author Of Trust) (10.04%)
3.97%
Quarterly Results Snapshot (Consolidated) - Mar'26 - QoQ

QoQ Growth in quarter ended Mar 2026 is 52.31% vs 0.38% in Dec 2025
QoQ Growth in quarter ended Mar 2026 is 117.20% vs -15.64% in Dec 2025
Half Yearly Results Snapshot (Consolidated) - Sep'25

Growth in half year ended Sep 2025 is 4.85% vs 7.22% in Sep 2024
Growth in half year ended Sep 2025 is -3.02% vs 129.91% in Sep 2024
Nine Monthly Results Snapshot (Consolidated) - Dec'25
YoY Growth in nine months ended Dec 2025 is 4.79% vs 15.33% in Dec 2024
YoY Growth in nine months ended Dec 2025 is -0.26% vs 114.73% in Dec 2024
Annual Results Snapshot (Consolidated) - Mar'26
YoY Growth in year ended Mar 2026 is 13.12% vs 18.41% in Mar 2025
YoY Growth in year ended Mar 2026 is 26.41% vs 1,536.45% in Mar 2025
About Godrej Industries Ltd

Company Coordinates


