
Compare Goldiam Intl. with Similar Stocks
Dashboard
The company is Net-Debt Free
The company has declared Positive results for the last 6 consecutive quarters
With ROE of 15.4, it has a Fair valuation with a 4.4 Price to Book Value
Despite the size of the company, domestic mutual funds hold only 0% of the company
Market Beating performance in long term as well as near term
Stock DNA
Gems, Jewellery And Watches
INR 4,901 Cr (Small Cap)
29.00
52
0.86%
-0.36
15.44%
4.42
Total Returns (Price + Dividend) 
Latest dividend: 2.74 per share ex-dividend date: Feb-12-2026
Risk Adjusted Returns v/s
Returns Beta

News
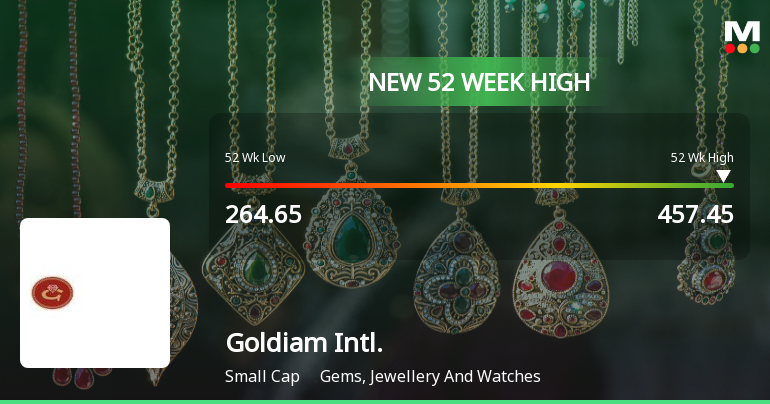
Broad-Based Technical Strength Lifts Goldiam International Ltd to 52-Week High of Rs 457.45
With a decisive surge to Rs 457.45 on 10 Jun 2026, Goldiam International Ltd has reached a fresh 52-week high, marking a 73% rally from its low of Rs 264.65. This milestone reflects a strong alignment of technical indicators and sustained price momentum that has propelled the stock well ahead of its sector and the broader market.
Read full news article
Goldiam International Ltd is Rated Hold
Goldiam International Ltd is rated 'Hold' by MarketsMOJO, with this rating last updated on 25 May 2026. While the rating was revised on that date, the analysis and financial metrics discussed here reflect the stock's current position as of 08 June 2026, providing investors with the most up-to-date perspective on the company’s performance and outlook.
Read full news article
Goldiam International Ltd is Rated Hold
Goldiam International Ltd is rated 'Hold' by MarketsMOJO, with this rating last updated on 25 May 2026. However, the analysis and financial metrics discussed here reflect the stock's current position as of 08 June 2026, providing investors with the latest insights into the company’s performance and outlook.
Read full news article Announcements
Announcement under Regulation 30 (LODR)-Analyst / Investor Meet - Intimation
09-Jun-2026 | Source : BSEIntimation of Group Meeting with Analysts / Investors/ Institutions under Regulation 30 of SEBI (LODR) Regulations 2015
Intimation Of Opening Of 25Th Retail Store For Lab-Grown Diamond Jewellery Under The Brand Name ORIGEM
08-Jun-2026 | Source : BSEIntimation of opening of 25th Store-ORIGEM
Announcement under Regulation 30 (LODR)-Newspaper Publication
02-Jun-2026 | Source : BSENewspaper Publication
Corporate Actions

No Upcoming Board Meetings

Goldiam International Ltd has declared 137% dividend, ex-date: 12 Feb 26

Goldiam International Ltd has announced 2:10 stock split, ex-date: 28 Mar 22

No Bonus history available

No Rights history available
Quality key factors
Valuation key factors
Technicals key factors
 Technical Indicator Scale: Bearish, Mildly Bearish, Sideways, Mildly Bullish, Bullish Turned
 Shareholding Snapshot : Mar 2026
Shareholding Compare (%holding)
Promoters
None
Held by 1 Schemes (0.0%)
Held by 39 FIIs (0.62%)
Rashesh Manhar Bhansali (38.39%)
Anant Jain (1.58%)
32.75%
Quarterly Results Snapshot (Consolidated) - Mar'26 - YoY

YoY Growth in quarter ended Mar 2026 is 18.14% vs 34.30% in Mar 2025

YoY Growth in quarter ended Mar 2026 is 61.38% vs 30.70% in Mar 2025
Half Yearly Results Snapshot (Consolidated) - Sep'25
Growth in half year ended Sep 2025 is 39.55% vs 19.59% in Sep 2024
Growth in half year ended Sep 2025 is 47.06% vs 8.66% in Sep 2024
Nine Monthly Results Snapshot (Consolidated) - Dec'25
YoY Growth in nine months ended Dec 2025 is 27.44% vs 28.00% in Dec 2024
YoY Growth in nine months ended Dec 2025 is 42.01% vs 28.43% in Dec 2024
Annual Results Snapshot (Consolidated) - Mar'26
YoY Growth in year ended Mar 2026 is 25.08% vs 29.54% in Mar 2025
YoY Growth in year ended Mar 2026 is 45.77% vs 28.87% in Mar 2025
About Goldiam International Ltd

Company Coordinates


