
Compare Goldman Sachs Infr. with Similar Stocks
Total Returns (Price + Dividend) 
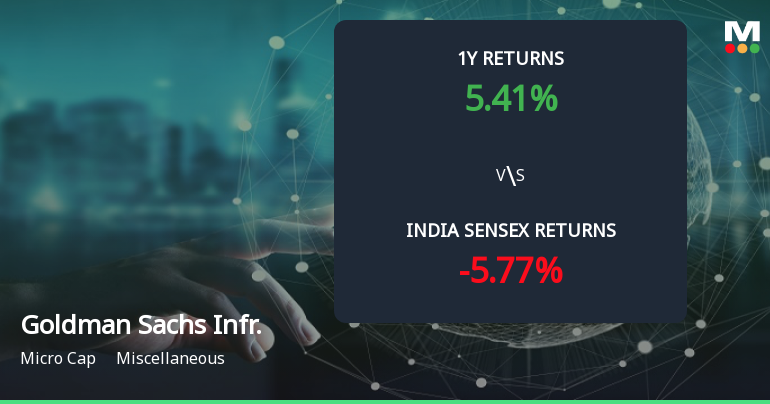
Goldman Sachs Infr. for the last several years.
Risk Adjusted Returns v/s
Returns Beta

News
Golden Cross Forms in Goldman Sachs Infr. — Mixed Technical Signals Cloud the Outlook
The 50-day moving average has crossed above the 200-day moving average for Goldman Sachs Infr. on 23 Jun 2026, signalling a golden cross. Yet, the broader technical picture is nuanced, with some indicators supporting the move while others remain inconclusive or absent. This divergence invites a closer look at whether the crossover is a reliable signal or a lone beacon amid mixed momentum.
Read full news article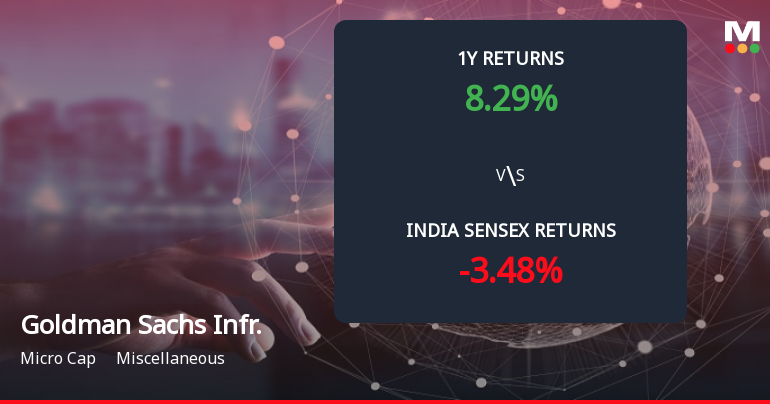
Goldman Sachs Infr. Forms Death Cross Signalling Potential Bearish Trend
Goldman Sachs Infr., a micro-cap stock with a market capitalisation of Rs 31.71 crores, has recently formed a Death Cross, a significant technical indicator where the 50-day moving average (DMA) crosses below the 200-DMA. This development suggests a potential shift towards a bearish trend, signalling possible long-term weakness and trend deterioration for the stock.
Read full news article Announcements
Corporate Actions
Quality key factors
No Data Found
Valuation key factors
No Data Found
Technicals key factors
 Technical Indicator Scale: Bearish, Mildly Bearish, Sideways, Mildly Bullish, Bullish Turned
 Shareholding Snapshot
Shareholding Compare (%holding)
About

Company Coordinates


