
Compare Goodricke Group with Similar Stocks
Dashboard
With a Operating Losses, the company has a Weak Long Term Fundamental Strength
- Company's ability to service its debt is weak with a poor EBIT to Interest (avg) ratio of -1.51
- The company has been able to generate a Return on Equity (avg) of 2.64% signifying low profitability per unit of shareholders funds
Flat results in Mar 26
Total Returns (Price + Dividend) 
Latest dividend: 3 per share ex-dividend date: Jul-19-2022
Risk Adjusted Returns v/s
Returns Beta

News
Goodricke Group Ltd is Rated Strong Sell
Goodricke Group Ltd is rated Strong Sell by MarketsMOJO, with this rating last updated on 03 Mar 2025. However, the analysis and financial metrics presented here reflect the stock's current position as of 10 June 2026, providing investors with an up-to-date view of the company’s fundamentals, valuation, financial trend, and technical outlook.
Read full news article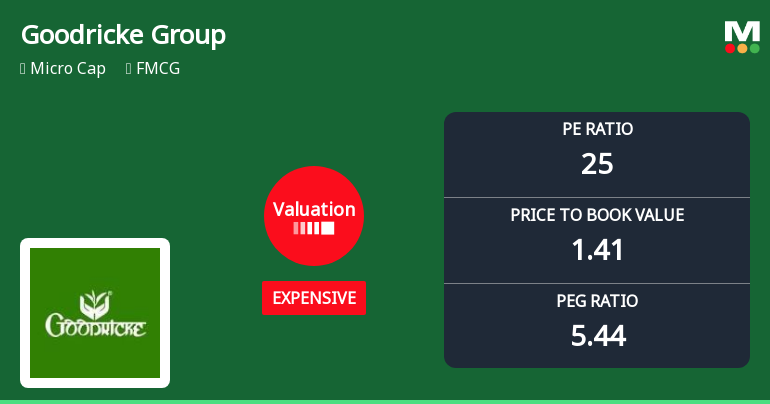
Goodricke Group Ltd Valuation Shifts Signal Expensive Terrain Amidst Mixed Market Returns
Goodricke Group Ltd, a micro-cap player in the FMCG sector, has seen a notable shift in its valuation parameters, moving from a risky to an expensive valuation grade. This change, coupled with a recent downgrade in its Mojo Grade to Strong Sell, raises important questions about its price attractiveness relative to historical levels and peer benchmarks.
Read full news articleAre Goodricke Group Ltd latest results good or bad?
Goodricke Group Ltd's latest financial results for Q4 FY26 highlight significant operational challenges. The company reported net sales of ₹103.85 crores, reflecting a substantial sequential decline of 66.10% from ₹306.37 crores in Q3 FY26 and a year-on-year decrease of 21.23% from ₹131.84 crores in Q4 FY25. This decline underscores the impact of seasonal production cycles, particularly during the winter months when tea production is minimal. The company incurred a net loss of ₹29.21 crores in Q4 FY26, a stark contrast to the profit of ₹8.04 crores recorded in the previous quarter. The operating margin, excluding other income, turned negative at -23.65%, down from a positive margin of 2.68% in Q3 FY26. Similarly, the profit after tax (PAT) margin fell to -28.13%, compared to -27.74% in Q4 FY25. These figures indicate a severe deterioration in profitability and highlight the structural cost challenges faced...
Read full news article Announcements
Announcement under Regulation 30 (LODR)-Newspaper Publication
29-May-2026 | Source : BSENewspaper Publication for Transfer of Shares to IEPF
Announcement under Regulation 30 (LODR)-Newspaper Publication
29-May-2026 | Source : BSENewspaper Publication for Audited Financial Results of the Company for the FY ended 31st March 2026
Corporate Action-Board approves Dividend
27-May-2026 | Source : BSERecommended Dividend of Rs. 2 per equity share of Rs. 10 each (i.e. 20%)
Corporate Actions

No Upcoming Board Meetings

Goodricke Group Ltd has declared 20% dividend, ex-date: 22 Jul 26

No Splits history available

No Bonus history available

No Rights history available
Quality key factors
Valuation key factors
Technicals key factors
 Technical Indicator Scale: Bearish, Mildly Bearish, Sideways, Mildly Bullish, Bullish Turned
 Shareholding Snapshot : Mar 2026
Shareholding Compare (%holding)
Promoters
None
Held by 1 Schemes (0.0%)
Held by 1 FIIs (0.18%)
Assam Dooars Investments Limited (48.1%)
None
22.09%
Quarterly Results Snapshot (Standalone) - Mar'26 - QoQ

QoQ Growth in quarter ended Mar 2026 is -66.10% vs 41.47% in Dec 2025
QoQ Growth in quarter ended Mar 2026 is -463.31% vs -81.53% in Dec 2025
Half Yearly Results Snapshot (Standalone) - Sep'25
Growth in half year ended Sep 2025 is -23.82% vs 26.08% in Sep 2024
Growth in half year ended Sep 2025 is -35.79% vs 130.47% in Sep 2024
Nine Monthly Results Snapshot (Standalone) - Dec'25
YoY Growth in nine months ended Dec 2025 is -12.56% vs 14.97% in Dec 2024
YoY Growth in nine months ended Dec 2025 is -3.30% vs 767.23% in Dec 2024
Annual Results Snapshot (Standalone) - Mar'26
YoY Growth in year ended Mar 2026 is -13.79% vs 12.80% in Mar 2025
YoY Growth in year ended Mar 2026 is 27.37% vs 128.95% in Mar 2025
About Goodricke Group Ltd

Company Coordinates


