
Compare GP Petroleums with Similar Stocks
Dashboard
Company has a Debt to Equity ratio (avg) of 0.09 times
Poor long term growth as Net Sales has grown by an annual rate of 1.04% and Operating profit at 7.31% over the last 5 years
Flat results in Mar 26
With ROE of 8.1, it has a Very Attractive valuation with a 0.6 Price to Book Value
Majority shareholders : Non Institution
Underperformed the market in the last 1 year
Total Returns (Price + Dividend) 
Latest dividend: 0.75 per share ex-dividend date: Sep-21-2020
Risk Adjusted Returns v/s
Returns Beta

News
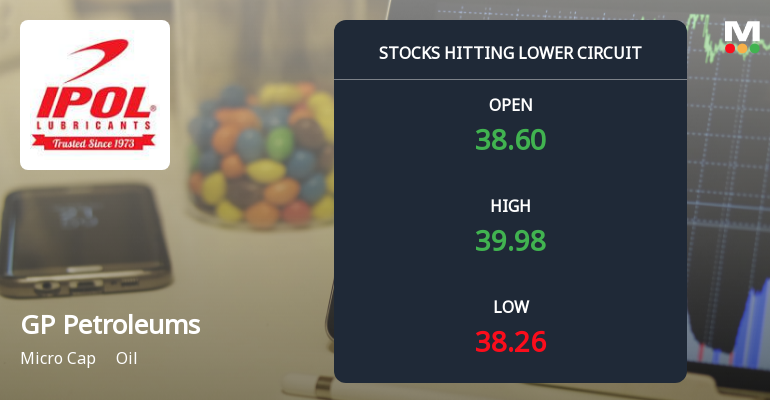
GP Petroleums Ltd Locks at Lower Circuit With 4.99% Loss — Sellers Queue, No Buyers in Sight
At Rs 38.25, sellers were still queuing — but there were no buyers willing to take the other side. GP Petroleums Ltd locked at its lower circuit of 4.99% on 09 Jun 2026, with unfilled sell orders and a frozen price, reflecting persistent selling pressure in a micro-cap stock with limited liquidity.
Read full news article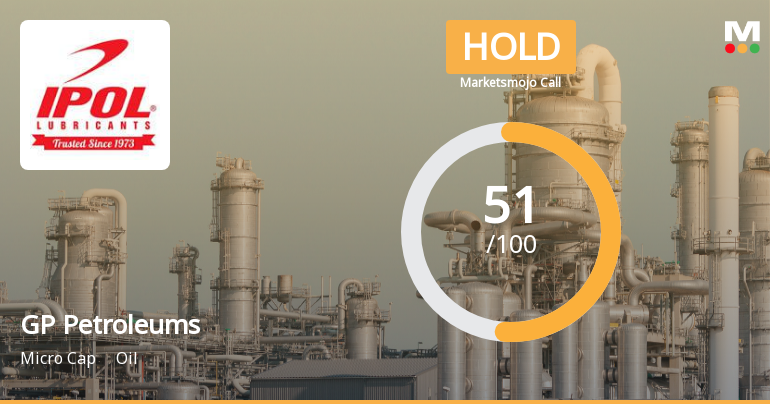
GP Petroleums Ltd Upgraded to Hold as Technicals Improve Amid Flat Financials
GP Petroleums Ltd has seen its investment rating upgraded from Sell to Hold as of 1 June 2026, reflecting a notable shift in technical indicators and valuation metrics despite flat recent financial performance. This upgrade is driven primarily by improved technical trends, attractive valuation ratios, and a stable financial outlook, signalling a cautious but more optimistic stance for investors in this oil sector micro-cap.
Read full news article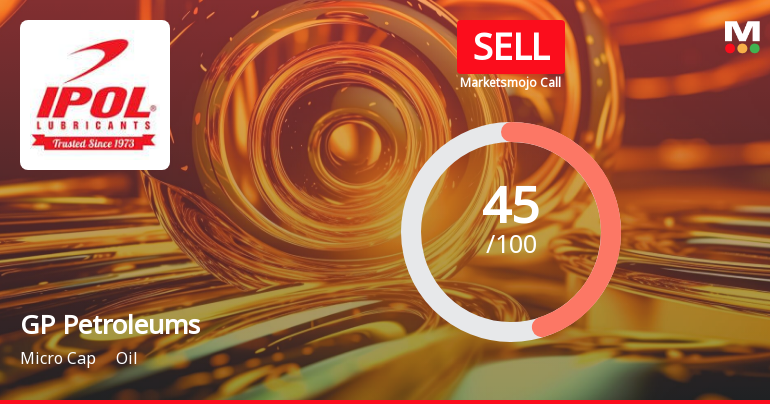
GP Petroleums Ltd is Rated Sell
GP Petroleums Ltd is rated Sell by MarketsMOJO, with this rating last updated on 01 Aug 2025. However, the analysis and financial metrics discussed here reflect the stock’s current position as of 31 May 2026, providing investors with an up-to-date view of the company’s fundamentals, returns, and market standing.
Read full news article Announcements
Announcement under Regulation 30 (LODR)-Newspaper Publication
28-May-2026 | Source : BSENewspaper publication of Audited Standalone and Consolidated Financial Results for the Quarter and Year ended March 31 2026.
Intimation Regarding The Second Phase Of Saksham Niveshak - 100 Days Campaign
21-May-2026 | Source : BSEIntimation regarding the Second Phase of Saksham Niveshak - 100 Day Campaign.
Compliances-Reg.24(A)-Annual Secretarial Compliance
21-May-2026 | Source : BSEAnnual Secretarial Compliance Report for the Financial Year March 2026.
Corporate Actions

No Upcoming Board Meetings

GP Petroleums Ltd has declared 15% dividend, ex-date: 21 Sep 20

No Splits history available

GP Petroleums Ltd has announced 23:19 bonus issue, ex-date: 09 Jul 13

No Rights history available
Quality key factors
Valuation key factors
Technicals key factors
 Technical Indicator Scale: Bearish, Mildly Bearish, Sideways, Mildly Bullish, Bullish Turned
 Shareholding Snapshot : Dec 2025
Shareholding Compare (%holding)
Non Institution
None
Held by 0 Schemes
Held by 3 FIIs (0.42%)
Gp Global Apac Pte Ltd (39.65%)
Incubit Energy (singapore) Pte Ltd (13.89%)
39.67%
Quarterly Results Snapshot (Standalone) - Dec'25 - QoQ

QoQ Growth in quarter ended Dec 2025 is 11.22% vs -3.81% in Sep 2025
QoQ Growth in quarter ended Dec 2025 is -4.20% vs -15.06% in Sep 2025
Half Yearly Results Snapshot (Standalone) - Sep'25
Growth in half year ended Sep 2025 is 6.65% vs -14.24% in Sep 2024
Growth in half year ended Sep 2025 is 7.88% vs -21.98% in Sep 2024
Nine Monthly Results Snapshot (Standalone) - Dec'25
YoY Growth in nine months ended Dec 2025 is 12.34% vs -13.64% in Dec 2024
YoY Growth in nine months ended Dec 2025 is -3.16% vs -14.11% in Dec 2024
Annual Results Snapshot (Standalone) - Mar'26
YoY Growth in year ended Mar 2026 is 5.37% vs -6.92% in Mar 2025
YoY Growth in year ended Mar 2026 is 0.57% vs -5.02% in Mar 2025
About GP Petroleums Ltd

Company Coordinates


