
Compare GPT Healthcare with Similar Stocks
Dashboard
High Management Efficiency with a high ROCE of 25.62%
Strong ability to service debt as the company has a low Debt to EBITDA ratio of 1.18 times
Poor long term growth as Operating profit has grown by an annual rate -9.60% of over the last 5 years
Flat results in Mar 26
With ROCE of 18.7, it has a Attractive valuation with a 3.9 Enterprise value to Capital Employed
Increasing Participation by Institutional Investors
Consistent Underperformance against the benchmark over the last 3 years
Total Returns (Price + Dividend) 
Latest dividend: 1 per share ex-dividend date: Nov-14-2025
Risk Adjusted Returns v/s
Returns Beta

News

GPT Healthcare Ltd Shows Mildly Bullish Momentum Amid Technical Upgrades
GPT Healthcare Ltd has exhibited a notable shift in its technical momentum, transitioning from a sideways trend to a mildly bullish stance. This change is underscored by mixed signals from key technical indicators such as MACD, RSI, Bollinger Bands, and moving averages, reflecting a nuanced outlook for this micro-cap hospital sector stock as it trades near ₹150.
Read full news article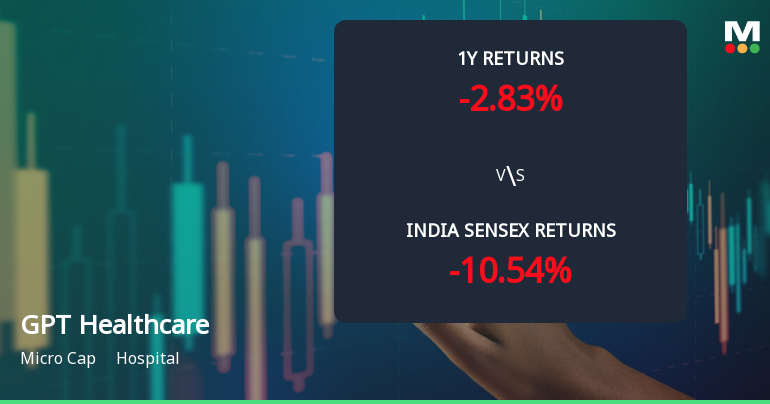
GPT Healthcare Ltd Technical Momentum Shifts Amid Sideways Trend
GPT Healthcare Ltd, a micro-cap player in the hospital sector, has witnessed a notable shift in its technical momentum, moving from a mildly bullish stance to a sideways trend. Despite a recent downgrade from a Sell to a Hold rating by MarketsMOJO on 30 September 2025, the stock’s technical indicators present a mixed picture, reflecting both resilience and caution in price action.
Read full news article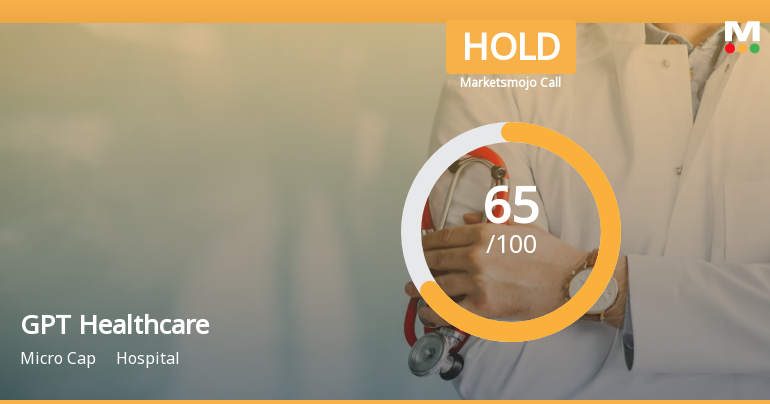
GPT Healthcare Ltd is Rated Hold
GPT Healthcare Ltd is rated 'Hold' by MarketsMOJO, with this rating last updated on 18 May 2026. While the rating change occurred on that date, the analysis and financial metrics discussed here reflect the stock's current position as of 08 June 2026, providing investors with an up-to-date view of the company’s fundamentals, valuation, financial trends, and technical outlook.
Read full news article Announcements
Intimation Regarding Second 100 Days Campaign-Saksham Niveshak
08-Jun-2026 | Source : BSEPlease find the enclosed letter/communication with shareholders.
Announcement under Regulation 30 (LODR)-Analyst / Investor Meet - Intimation
05-Jun-2026 | Source : BSEPlease find enclosed herewith the Letter for Investor Meet on June 11 2026.
Compliances-Reg.24(A)-Annual Secretarial Compliance
26-May-2026 | Source : BSEPlease find enclosed herewith the Annual Secretarial Compliance Report for year ended March 31 2026.
Corporate Actions

No Upcoming Board Meetings

GPT Healthcare Ltd has declared 15% dividend, ex-date: 30 Jul 26

No Splits history available

No Bonus history available

No Rights history available
Quality key factors
Valuation key factors
Technicals key factors
 Technical Indicator Scale: Bearish, Mildly Bearish, Sideways, Mildly Bullish, Bullish Turned
 Shareholding Snapshot : Mar 2026
Shareholding Compare (%holding)
Promoters
None
Held by 2 Schemes (4.69%)
Held by 6 FIIs (2.81%)
Gpt Sons Private Limited (65.57%)
Bandhan Small Cap Fund (4.69%)
18.33%
Quarterly Results Snapshot (Standalone) - Mar'26 - QoQ

QoQ Growth in quarter ended Mar 2026 is 5.17% vs 1.05% in Dec 2025
QoQ Growth in quarter ended Mar 2026 is 55.50% vs -11.60% in Dec 2025
Half Yearly Results Snapshot (Standalone) - Sep'25
Growth in half year ended Sep 2025 is 11.08% vs -0.34% in Sep 2024

Growth in half year ended Sep 2025 is -26.22% vs 5.53% in Sep 2024
Nine Monthly Results Snapshot (Standalone) - Dec'25
YoY Growth in nine months ended Dec 2025 is 13.25% vs 1.64% in Dec 2024
YoY Growth in nine months ended Dec 2025 is -25.32% vs 5.95% in Dec 2024
Annual Results Snapshot (Standalone) - Mar'26
YoY Growth in year ended Mar 2026 is 16.08% vs 1.72% in Mar 2025
YoY Growth in year ended Mar 2026 is -15.42% vs 4.50% in Mar 2025
About GPT Healthcare Ltd

Company Coordinates


