
Compare GPT Infraproject with Similar Stocks
Stock DNA
Construction
INR 1,513 Cr (Micro Cap)
15.00
42
3.08%
0.40
16.14%
2.52
Total Returns (Price + Dividend) 
Latest dividend: 0.9919898819561552 per share ex-dividend date: May-26-2026
Risk Adjusted Returns v/s
Returns Beta

News
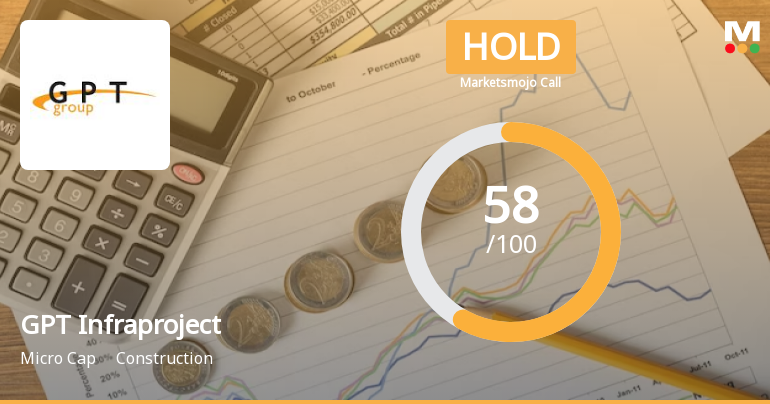
GPT Infraprojects Ltd is Rated Hold by MarketsMOJO
GPT Infraprojects Ltd is rated 'Hold' by MarketsMOJO, with this rating last updated on 27 May 2026. While the rating change occurred on that date, all fundamentals, returns, and financial metrics discussed here reflect the stock's current position as of 23 July 2026.
Read full news article
GPT Infraprojects Ltd is Rated Hold by MarketsMOJO
GPT Infraprojects Ltd is rated 'Hold' by MarketsMOJO, with this rating last updated on 27 May 2026. While the rating change occurred on that date, all fundamentals, returns, and financial metrics discussed here reflect the company’s current position as of 12 July 2026.
Read full news article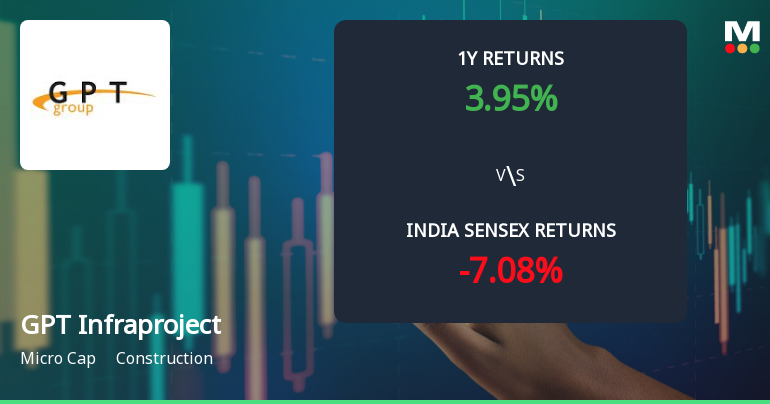
GPT Infraprojects Ltd Technical Momentum Shifts Amid Mixed Indicator Signals
GPT Infraprojects Ltd, a micro-cap player in the construction sector, has experienced a nuanced shift in its technical momentum, reflecting a complex interplay of bullish and bearish signals across key indicators. Despite a recent downgrade in daily price performance, the stock’s medium- to long-term trends reveal a cautiously optimistic outlook, supported by improved technical grades and a notable outperformance against the Sensex over multiple time horizons.
Read full news article Announcements
Announcement under Regulation 30 (LODR)-Analyst / Investor Meet - Intimation
25-Jul-2026 | Source : BSEPlease find enclosed herewith intimation for Investor Meet to be held on August 03 2026.
Board Meeting Intimation for Board Meeting Intimation For Approval Of Un-Audited Financial Results Of The Company For The Quarter Ended June 30 2026.
24-Jul-2026 | Source : BSEGPT Infraprojects Ltdhas informed BSE that the meeting of the Board of Directors of the Company is scheduled on 01/08/2026 inter alia to consider and approve GPT Infraprojects Limited has informed BSE that the meeting of the Board of Directors of the Company is scheduled on 01/08/2026 inter alia to consider and approve Un-audited Financial Results (Standalone & Consolidated) for the quarter ended June 30 2026
Announcement under Regulation 30 (LODR)-Newspaper Publication
11-Jul-2026 | Source : BSEPlease find enclosed herewith copies of the newspaper publication post dispatch of Annual report and 46th AGM of the Company
Corporate Actions

01 Aug 2026

GPT Infraprojects Ltd has declared 10% dividend, ex-date: 26 May 26

No Splits history available

GPT Infraprojects Ltd has announced 1:1 bonus issue, ex-date: 03 Jul 24

No Rights history available
Quality key factors
Valuation key factors
Technicals key factors
 Technical Indicator Scale: Bearish, Mildly Bearish, Sideways, Mildly Bullish, Bullish Turned
 Shareholding Snapshot : Jun 2026
Shareholding Compare (%holding)
Promoters
50.7674
Held by 1 Schemes (4.07%)
Held by 7 FIIs (2.96%)
Gpt Sons Private Limited (48.0%)
Bandhan Infrastructure Fund (4.07%)
12.68%
Quarterly Results Snapshot (Consolidated) - Mar'26 - YoY

YoY Growth in quarter ended Mar 2026 is 8.91% vs 29.06% in Mar 2025
YoY Growth in quarter ended Mar 2026 is 31.52% vs 49.72% in Mar 2025
Half Yearly Results Snapshot (Consolidated) - Sep'25
Growth in half year ended Sep 2025 is 11.72% vs 12.72% in Sep 2024

Growth in half year ended Sep 2025 is 31.55% vs 28.67% in Sep 2024
Nine Monthly Results Snapshot (Consolidated) - Dec'25
YoY Growth in nine months ended Dec 2025 is 8.41% vs 11.62% in Dec 2024
YoY Growth in nine months ended Dec 2025 is 17.17% vs 34.04% in Dec 2024
Annual Results Snapshot (Consolidated) - Mar'26
YoY Growth in year ended Mar 2026 is 8.57% vs 16.67% in Mar 2025
YoY Growth in year ended Mar 2026 is 21.53% vs 38.43% in Mar 2025
About GPT Infraprojects Ltd

Company Coordinates


