
Compare Greenlam Industr with Similar Stocks
Dashboard
With a growth in Net Profit of 2658.5%, the company declared Outstanding results in Mar 26
- OPERATING PROFIT TO INTEREST(Q) Highest at 4.70 times
- CASH AND CASH EQUIVALENTS(HY) Highest at Rs 63.97 cr
- DEBT-EQUITY RATIO(HY) Lowest at 0.98 times
With ROCE of 8.2, it has a Fair valuation with a 3.4 Enterprise value to Capital Employed
Majority shareholders : Promoters
Market Beating Performance
Stock DNA
Plywood Boards/ Laminates
INR 6,668 Cr (Small Cap)
105.00
32
0.00%
0.89
5.29%
5.58
Total Returns (Price + Dividend) 
Latest dividend: 0.4 per share ex-dividend date: Jun-20-2025
Risk Adjusted Returns v/s
Returns Beta

News
Greenlam Industries Ltd Upgraded to Buy on Strong Technical and Financial Performance
Greenlam Industries Ltd has been upgraded from a Hold to a Buy rating, reflecting a marked improvement across key investment parameters including quality, valuation, financial trends, and technical indicators. This upgrade, effective from 24 June 2026, is underpinned by the company’s robust quarterly financial performance, attractive valuation metrics relative to peers, and a shift towards a more bullish technical outlook.
Read full news article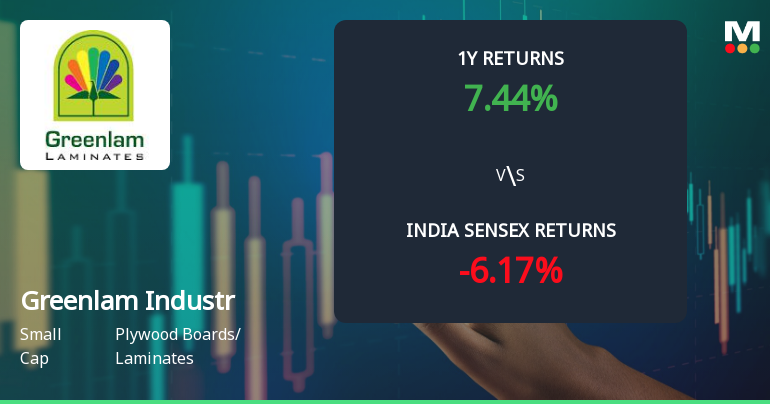
Greenlam Industries Ltd Technical Momentum Shifts Signal Mildly Bullish Outlook
Greenlam Industries Ltd has exhibited a notable shift in its technical momentum, moving from a sideways trend to a mildly bullish stance. This change is underscored by mixed signals from key technical indicators such as MACD, RSI, Bollinger Bands, and moving averages, suggesting cautious optimism for investors in the plywood boards and laminates sector.
Read full news article
Greenlam Industries Ltd is Rated Hold by MarketsMOJO
Greenlam Industries Ltd is rated 'Hold' by MarketsMOJO, with this rating last updated on 22 May 2026. While the rating was revised on that date, the analysis and financial metrics discussed here reflect the company’s current position as of 21 June 2026, providing investors with an up-to-date view of the stock’s fundamentals, valuation, financial trends, and technical outlook.
Read full news article Announcements
Greenlam Industries Limited - Analysts/Institutional Investor Meet/Con. Call Updates
05-Nov-2019 | Source : NSEGreenlam Industries Limited has informed the Exchange regarding Analysts/Institutional Investor Meet/Con. Call Updates
Greenlam Industries Limited - Analysts/Institutional Investor Meet/Con. Call Updates
24-Sep-2019 | Source : NSEGreenlam Industries Limited has informed the Exchange regarding Analysts/Institutional Investor Meet/Con. Call Updates
Analysts\/Institutional Investor Meet\/Con. Call Updates
23-Sep-2019 | Source : NSE
| Greenlam Industries Limited has informed the Exchange regarding Analysts/Institutional Investor Meet/Con. Call Updates |
Corporate Actions

No Upcoming Board Meetings

Greenlam Industries Ltd has declared 40% dividend, ex-date: 03 Jul 26

Greenlam Industries Ltd has announced 1:5 stock split, ex-date: 10 Feb 22

Greenlam Industries Ltd has announced 1:1 bonus issue, ex-date: 21 Mar 25

No Rights history available
Quality key factors
Valuation key factors
Technicals key factors
 Technical Indicator Scale: Bearish, Mildly Bearish, Sideways, Mildly Bullish, Bullish Turned
 Shareholding Snapshot : Mar 2026
Shareholding Compare (%holding)
Promoters
None
Held by 4 Schemes (11.28%)
Held by 55 FIIs (1.78%)
Sm Greenlam Investments Private Limited (37.78%)
Upnishad Holdings Private Limited (7.4%)
16.65%
Quarterly Results Snapshot (Consolidated) - Mar'26 - YoY

YoY Growth in quarter ended Mar 2026 is 25.80% vs 9.24% in Mar 2025
YoY Growth in quarter ended Mar 2026 is 1,797.12% vs -94.92% in Mar 2025
Half Yearly Results Snapshot (Consolidated) - Sep'25
Growth in half year ended Sep 2025 is 15.29% vs 14.89% in Sep 2024

Growth in half year ended Sep 2025 is -69.08% vs -23.90% in Sep 2024
Nine Monthly Results Snapshot (Consolidated) - Dec'25
YoY Growth in nine months ended Dec 2025 is 15.94% vs 12.20% in Dec 2024
YoY Growth in nine months ended Dec 2025 is -75.15% vs -30.62% in Dec 2024
Annual Results Snapshot (Consolidated) - Mar'26
YoY Growth in year ended Mar 2026 is 18.56% vs 11.40% in Mar 2025
YoY Growth in year ended Mar 2026 is -19.27% vs -49.64% in Mar 2025
About Greenlam Industries Ltd

Company Coordinates


