
Compare Greystone Housing Impact Investors LP with Similar Stocks
Dashboard
Strong Long Term Fundamental Strength with a 6.08% CAGR growth in Operating Profits
Weak Long Term Fundamental Strength with an average Return on Equity (ROE) of 8.15%
The company has declared Negative results for the last 7 consecutive quarters
With ROE of 3.47%, it has a very attractive valuation with a 0.71 Price to Book Value
Consistent Underperformance against the benchmark over the last 3 years
Total Returns (Price + Dividend) 
Greystone Housing Impact Investors LP for the last several years.
Risk Adjusted Returns v/s
News
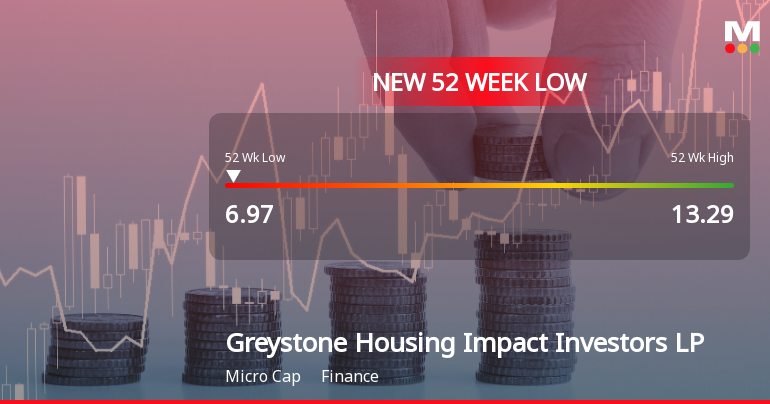
Greystone Housing Impact Investors Hits New 52-Week Low at $6.97
Greystone Housing Impact Investors LP has reached a new 52-week low, reflecting a challenging year marked by a significant stock price decline. The company has reported negative results for seven consecutive quarters, low return on equity, and a decrease in promoter confidence, indicating ongoing difficulties in the financial landscape.
Read full news article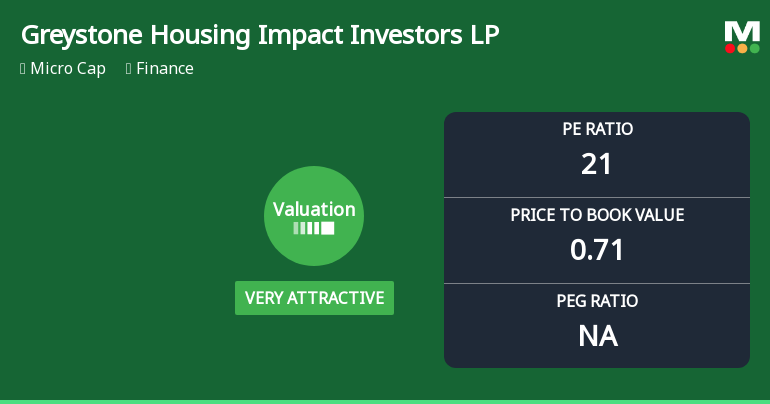
Greystone Housing Impact Investors LP Experiences Revision in Its Stock Evaluation Score
Greystone Housing Impact Investors LP has adjusted its valuation, revealing a P/E ratio of 21 and a price-to-book value of 0.71. The company shows strong operational efficiency with a ROCE of 23.65% and a ROE of 3.47%, positioning it favorably against peers in the finance industry.
Read full news article Announcements

Corporate Actions
Quality key factors
Valuation key factors
Technicals key factors
 Technical Indicator Scale: Bearish, Mildly Bearish, Sideways, Mildly Bullish, Bullish Turned
 Shareholding Snapshot : Jun 2025
Shareholding Compare (%holding)
Strategic Entities
Held in 0 Schemes (0%)
Held by 4 Foreign Institutions (0.11%)
Quarterly Results Snapshot (Consolidated) - Jun'25 - QoQ

QoQ Growth in quarter ended Jun 2025 is -6.54% vs 3.59% in Mar 2025
QoQ Growth in quarter ended Jun 2025 is -315.15% vs -67.33% in Mar 2025
Annual Results Snapshot (Consolidated) - Dec'24
YoY Growth in year ended Dec 2024 is -26.86% vs 12.79% in Dec 2023
YoY Growth in year ended Dec 2024 is -60.56% vs -17.68% in Dec 2023
About Greystone Housing Impact Investors LP

Company Coordinates


