
Compare GSP Crop Science with Similar Stocks
Stock DNA
Pesticides & Agrochemicals
INR 1,992 Cr (Small Cap)
20.00
28
0.00%
0.05
12.69%
2.72
Total Returns (Price + Dividend) 

Risk Adjusted Returns v/s
Returns Beta
News

GSP Crop Science Ltd Faces Mildly Bearish Momentum Amid Technical Downgrade
GSP Crop Science Ltd, a small-cap player in the Pesticides & Agrochemicals sector, has experienced a shift in technical momentum, prompting a downgrade in its Mojo Grade from Hold to Sell as of 1 June 2026. The stock’s recent price action and technical indicators suggest a transition from a sideways trend to a mildly bearish phase, reflecting growing investor caution amid mixed market signals.
Read full news article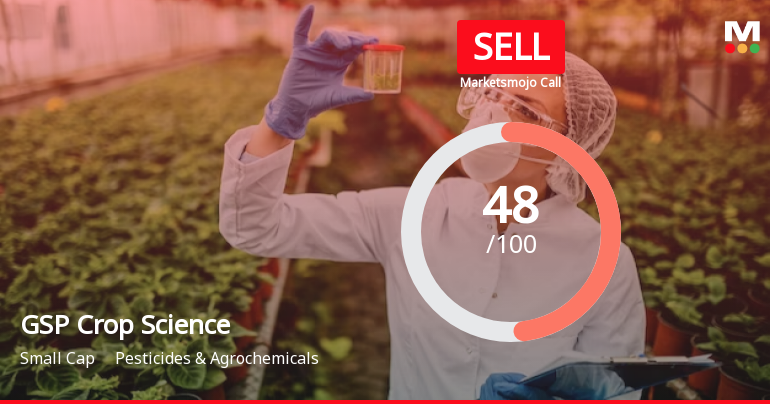
GSP Crop Science Ltd is Rated Sell
GSP Crop Science Ltd is rated Sell by MarketsMOJO, with this rating last updated on 01 June 2026. However, the analysis and financial metrics discussed here reflect the stock's current position as of 09 June 2026, providing investors with the most up-to-date view of the company’s fundamentals, valuation, financial trend, and technical outlook.
Read full news article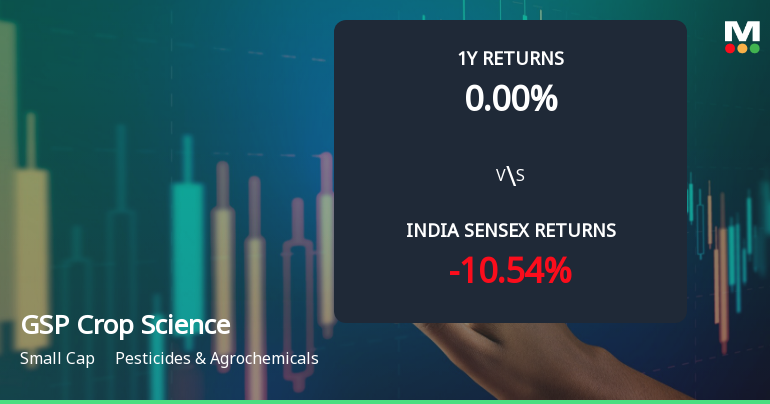
GSP Crop Science Ltd Technical Momentum Shifts Amid Sideways Trend
GSP Crop Science Ltd, a small-cap player in the Pesticides & Agrochemicals sector, has experienced a notable shift in price momentum and technical indicators, prompting a downgrade in its Mojo Grade from Hold to Sell as of 1 June 2026. The stock’s recent sideways trend and weakening momentum metrics signal caution for investors amid a challenging market backdrop.
Read full news article Announcements
Statement Of Deviation Or Variation For Quarter And Financial Year Ended March 31 2026
29-May-2026 | Source : BSEStatement of Deviation or Variation for quarter and Financial year ended March 31 2026
Audited Standalone And Consolidated Financial Results For The Quarter And Financial Year Ended March 31 2026
26-May-2026 | Source : BSEAudited Standalone and Consolidated Financial Result for the quarter and financial year ended March 31 2026
Appointment Of Internal Auditor Of The Company For FY 2026-27
26-May-2026 | Source : BSEAppointment of Mahajan & Aibara LLP internal auditor of the Company for FY 2026-27.
Corporate Actions

No Upcoming Board Meetings

No Dividend history available

No Splits history available

No Bonus history available

No Rights history available
Quality key factors
Valuation key factors
Technicals key factors
 Technical Indicator Scale: Bearish, Mildly Bearish, Sideways, Mildly Bullish, Bullish Turned
 Shareholding Snapshot : Mar 2026
Shareholding Compare (%holding)
Promoters
None
Held by 0 Schemes
Held by 8 FIIs (11.54%)
Kappa Trust (trustee - Falguni Kenal Shah) (19.18%)
Craft Emerging Market Fund Pcc-citadel Capital Fund (3.45%)
5.9%
Quarterly Results Snapshot (Standalone) - Mar'26 - QoQ

QoQ Growth in quarter ended Mar 2026 is 55.19% vs -44.64% in Dec 2025
QoQ Growth in quarter ended Mar 2026 is 940.86% vs -105.53% in Dec 2025
Half Yearly Results Snapshot (Consolidated) - Sep'24
Not Applicable: The company has declared_date for only one period
Not Applicable: The company has declared_date for only one period
Nine Monthly Results Snapshot (Consolidated) - Mar'26
Not Applicable: The company has declared_date for only one period
Not Applicable: The company has declared_date for only one period
Annual Results Snapshot (Consolidated) - Mar'26
YoY Growth in year ended Mar 2026 is 17.84% vs 11.74% in Mar 2025

YoY Growth in year ended Mar 2026 is 17.33% vs 36.05% in Mar 2025
About GSP Crop Science Ltd

Company Coordinates


