
Compare GTL with Similar Stocks
Dashboard
With a Negative Book Value, the company has a Weak Long Term Fundamental Strength
- Poor long term growth as Net Sales has grown by an annual rate of -1.54% and Operating profit at 0% over the last 5 years
- The company has a negative book value of Rs 6,052.56 crore
Negative results in Mar 26
Risky - Negative EBITDA
97.86% of Promoter Shares are Pledged
Below par performance in long term as well as near term
Stock DNA
Telecom - Services
INR 115 Cr (Micro Cap)
NA (Loss Making)
20
0.00%
-0.89
0.43%
-0.02
Total Returns (Price + Dividend) 
Latest dividend: 3 per share ex-dividend date: Jul-09-2010
Risk Adjusted Returns v/s
Returns Beta

News
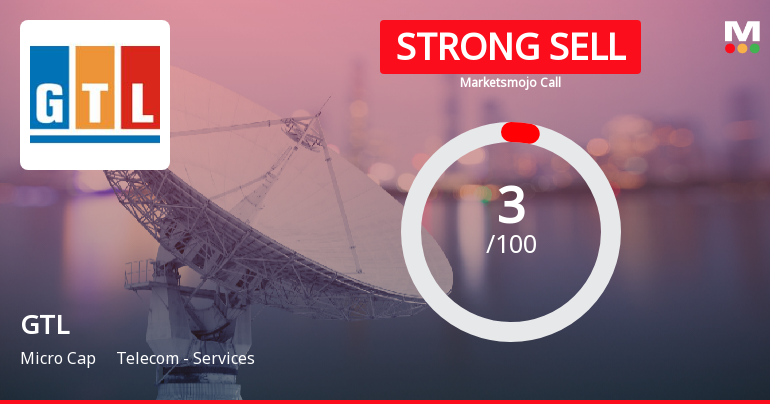
GTL Ltd is Rated Strong Sell
GTL Ltd is rated Strong Sell by MarketsMOJO, with this rating last updated on 17 June 2025. However, the analysis and financial metrics discussed here reflect the company’s current position as of 30 July 2026, providing investors with the latest insights into the stock’s performance and outlook.
Read full news article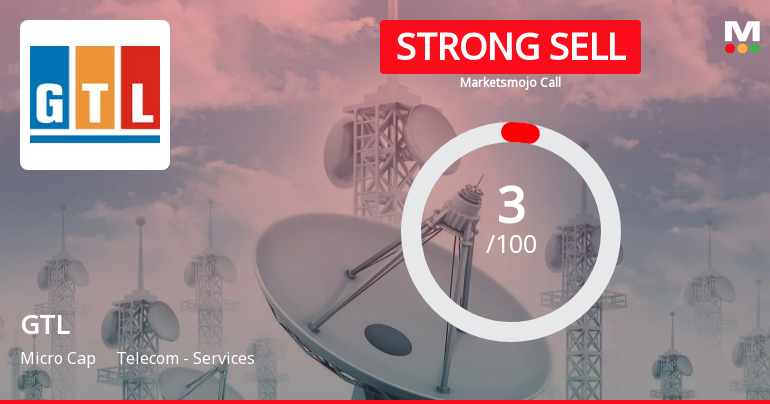
GTL Ltd is Rated Strong Sell
GTL Ltd is rated Strong Sell by MarketsMOJO, with this rating last updated on 17 June 2025. However, the analysis and financial metrics presented here reflect the company’s current position as of 19 July 2026, providing investors with an up-to-date view of the stock’s fundamentals, valuation, financial trend, and technical outlook.
Read full news article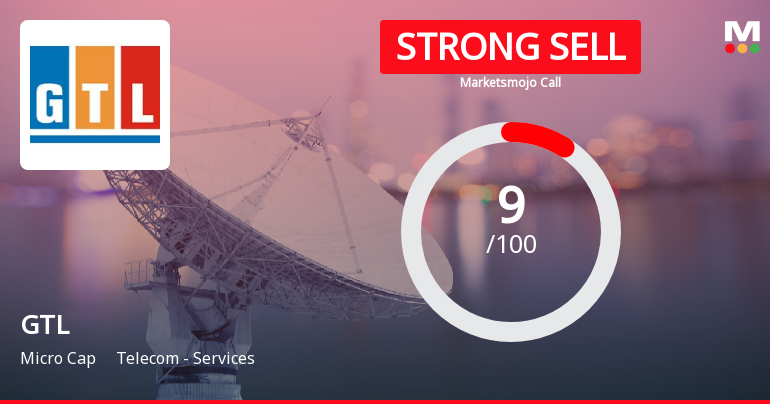
GTL Ltd is Rated Strong Sell
GTL Ltd is rated Strong Sell by MarketsMOJO, with this rating last updated on 17 June 2025. However, the analysis and financial metrics discussed here reflect the stock’s current position as of 07 July 2026, providing investors with an up-to-date view of the company’s fundamentals, valuation, financial trend, and technical outlook.
Read full news article Announcements
Compliances-Certificate under Reg. 74 (5) of SEBI (DP) Regulations 2018
07-Jul-2026 | Source : BSECertificate under Regulation 74(5) of the Securities and Exchange Board of India (Depositories and Participants) Regulations 2018 for the quarter ended June 30 2026
Closure of Trading Window
26-Jun-2026 | Source : BSETrading Window Closure Period under the Securities and Exchange of India (Prohibition of Insider Trading) Regulations 2015
Compliances-Reg.24(A)-Annual Secretarial Compliance
29-May-2026 | Source : BSESecretarial Compliance Report for the Financial Year ended March 31 2026
Corporate Actions

No Upcoming Board Meetings

GTL Ltd has declared 30% dividend, ex-date: 09 Jul 10

No Splits history available

No Bonus history available

No Rights history available
Quality key factors
Valuation key factors
Technicals key factors
 Technical Indicator Scale: Bearish, Mildly Bearish, Sideways, Mildly Bullish, Bullish Turned
 Shareholding Snapshot : Jun 2026
Shareholding Compare (%holding)
Non Institution
97.8623
Held by 0 Schemes
Held by 3 FIIs (0.1%)
Global Holding Corporation Private Limited (14.29%)
Union Bank Of India (4.8%)
70.61%
Quarterly Results Snapshot (Standalone) - Mar'26 - QoQ

QoQ Growth in quarter ended Mar 2026 is 5.91% vs -0.72% in Dec 2025
QoQ Growth in quarter ended Mar 2026 is 23,257.79% vs 93.34% in Dec 2025
Half Yearly Results Snapshot (Standalone) - Sep'25

Growth in half year ended Sep 2025 is -16.41% vs 43.31% in Sep 2024
Growth in half year ended Sep 2025 is -207.38% vs -68.59% in Sep 2024
Nine Monthly Results Snapshot (Standalone) - Dec'25
YoY Growth in nine months ended Dec 2025 is -9.70% vs 35.05% in Dec 2024
YoY Growth in nine months ended Dec 2025 is -35.27% vs -126.26% in Dec 2024
Annual Results Snapshot (Standalone) - Mar'26
YoY Growth in year ended Mar 2026 is -11.62% vs 25.73% in Mar 2025
YoY Growth in year ended Mar 2026 is 7,051.67% vs -103.98% in Mar 2025
About GTL Ltd

Company Coordinates


