
Compare GTL Infra. with Similar Stocks
Dashboard
With a Negative Book Value, the company has a Weak Long Term Fundamental Strength
- Poor long term growth as Operating profit has grown by an annual rate -35.45% of over the last 5 years
- The company has a negative book value of Rs 5,215.03 crore
Risky - Negative Book Value
100% of Promoter Shares are Pledged
Underperformed the market in the last 1 year
Stock DNA
Telecom - Equipment & Accessories
INR 1,870 Cr (Small Cap)
NA (Loss Making)
21
0.00%
-1.11
8.03%
-0.35
Total Returns (Price + Dividend) 
GTL Infra. for the last several years.
Risk Adjusted Returns v/s
Returns Beta

News

GTL Infrastructure Ltd Sees Exceptional Volume Surge Amid Mixed Market Sentiment
GTL Infrastructure Ltd (GTLINFRA) emerged as one of the most actively traded stocks on 11 June 2026, registering a remarkable volume surge that outpaced its sector and benchmark indices. Despite a modest price gain of 0.69%, the stock’s trading activity and technical indicators reveal a complex interplay of accumulation and distribution signals, reflecting investor caution amid a challenging telecom equipment landscape.
Read full news article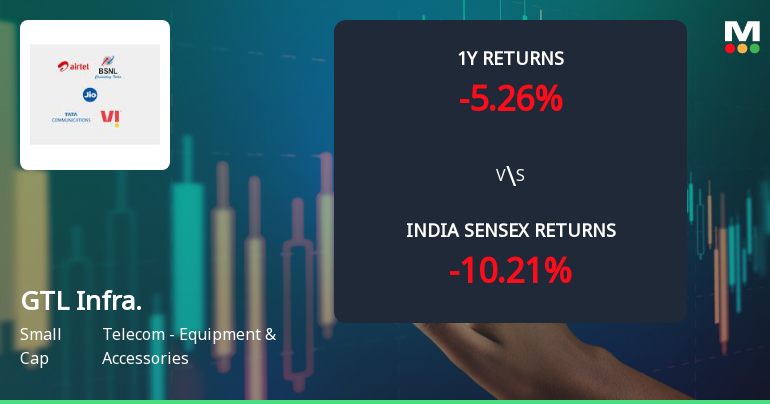
GTL Infrastructure Ltd Faces Mixed Technical Signals Amid Mildly Bearish Momentum
GTL Infrastructure Ltd (NSE: 171011), a small-cap player in the Telecom - Equipment & Accessories sector, has experienced a notable shift in its technical momentum, moving from a sideways trend to a mildly bearish stance. Despite some bullish weekly indicators, monthly signals and moving averages suggest caution for investors as the stock price declined 6.49% on 11 Jun 2026, closing at ₹1.44.
Read full news article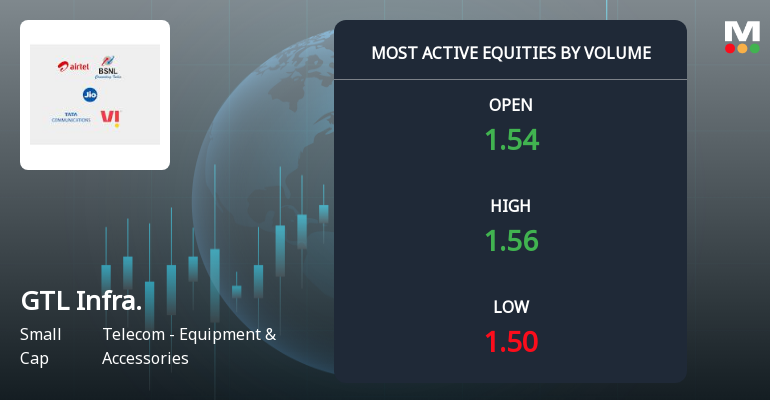
GTL Infrastructure Ltd Sees Exceptional Volume Amid Mixed Price Action and Strong Sell Rating
GTL Infrastructure Ltd (GTLINFRA), a small-cap player in the Telecom - Equipment & Accessories sector, witnessed one of the highest trading volumes on 10 June 2026, with over 1.54 crore shares changing hands. Despite this surge in activity, the stock underperformed its sector and closed lower, reflecting ongoing investor caution amid a recent downgrade to a Strong Sell rating by MarketsMOJO.
Read full news article Announcements
Compliances-Reg.24(A)-Annual Secretarial Compliance
30-May-2026 | Source : BSESecretarial Compliance Report for the Financial Year ended March 31 2026
Announcement under Regulation 30 (LODR)-Newspaper Publication
13-May-2026 | Source : BSECopy of news paper publication pertaining to financial results of the Company for the quarter and year ended March 31 2026
Audited Financial Results Of The Company For Quarter And Year Ended March 31 2026
12-May-2026 | Source : BSEAudited Financial Results of the Company for quarter and year ended March 31 2026
Corporate Actions

No Upcoming Board Meetings

No Dividend history available

No Splits history available

No Bonus history available

GTL Infrastructure Ltd has announced 1:1 rights issue, ex-date: 20 Jul 07
Quality key factors
Valuation key factors
Technicals key factors
 Technical Indicator Scale: Bearish, Mildly Bearish, Sideways, Mildly Bullish, Bullish Turned
 Shareholding Snapshot : Mar 2026
Shareholding Compare (%holding)
Non Institution
100
Held by 2 Schemes (0.0%)
Held by 5 FIIs (0.07%)
Global Holding Corporation Private Limited (3.28%)
Union Bank Of India (12.07%)
61.25%
Quarterly Results Snapshot (Standalone) - Mar'26 - QoQ

QoQ Growth in quarter ended Mar 2026 is -5.77% vs -1.66% in Dec 2025

QoQ Growth in quarter ended Mar 2026 is 5,955.06% vs 110.12% in Dec 2025
Half Yearly Results Snapshot (Standalone) - Sep'25
Growth in half year ended Sep 2025 is 3.36% vs -4.95% in Sep 2024
Growth in half year ended Sep 2025 is -2.35% vs -52.96% in Sep 2024
Nine Monthly Results Snapshot (Standalone) - Dec'25
YoY Growth in nine months ended Dec 2025 is 3.43% vs -3.25% in Dec 2024
YoY Growth in nine months ended Dec 2025 is 35.12% vs -34.21% in Dec 2024
Annual Results Snapshot (Standalone) - Mar'26
YoY Growth in year ended Mar 2026 is 2.08% vs -2.04% in Mar 2025
YoY Growth in year ended Mar 2026 is 189.04% vs -28.44% in Mar 2025
About GTL Infrastructure Ltd

Company Coordinates


