Guj Inds. Power

INR
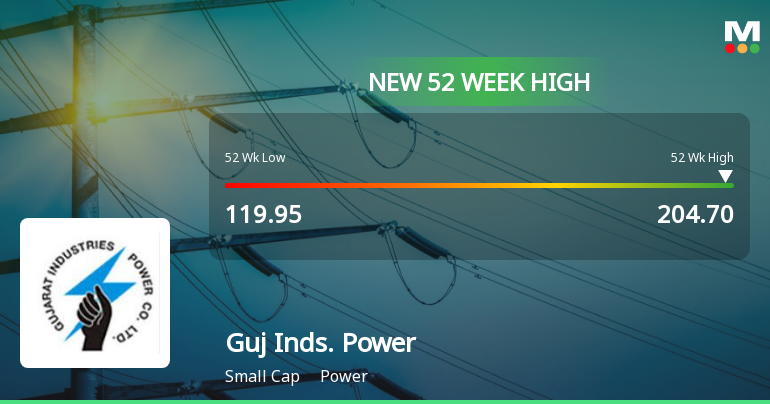
202.95
1.35 (0.67%)
BSENSE

Aug 27, 02:10 PM

BSE+NSE Vol: 16.44 lacs

  • Price Points
  • Score
  • Mojo Parameters
  • Total Return
  • News and Corporate Actions
  • Key factors
  • Shareholding
  • Financials
  • CompanyCV
stock-summaryPrice Point
High/Low

1Day

52 Week

Valuation
Technical
Day's Volume

CASH

16.44 lacs (6.51%) Volume

Shareholding (Jun 2026)

FII

2.89%

Held by 38 FIIs

DII

6.42%

Held by 7 DIIs

Promoter

56.57%

Why is Gujarat Industries Power Co Ltd falling/rising?

27-Aug-2026

As of 26-Aug, Gujarat Industries Power Co Ltd's stock price has risen to 201.60, reflecting a 5.8% increase. This growth is driven by strong financial performance, significant investor interest, and a notable outperformance compared to the Sensex.

As of 26-Aug, Gujarat Industries Power Co Ltd is experiencing a rise in its stock price, currently at 201.60, which reflects an increase of 11.05 or 5.8%. This upward movement can be attributed to several positive factors. Over the past week, the stock has surged by 17.28%, significantly outperforming the Sensex, which only rose by 0.73%. In the last month, the stock has increased by 28.45%, while the Sensex has gained just 1.86%. Year-to-date, the stock has shown a remarkable increase of 28.69%, contrasting sharply with the Sensex's decline of 9.09%.<BR><BR>The stock's performance today has also been notable, as it is just 2.18% away from its 52-week high of Rs 204.35 and has outperformed its sector by 5.82%. Additionally, the stock has been on a consecutive gain streak for the last four days, accumulating a total return of 19.05% during this period. It reached an intraday high of Rs 203.95, marking a 7.03% increase.<BR><BR>Investor participation has risen significantly, with a delivery volume of 17.16 lacs on 25 August, which is up by 344.55% compared to the five-day average. The stock is also trading above its moving averages across various time frames, indicating a strong bullish trend. Furthermore, the company's financial performance has been robust, with a 281.09% growth in profit after tax over the latest six months and a 30.68% increase in net sales.<BR><BR>Overall, the combination of strong financial results, positive market performance, and increased investor interest has contributed to the rising stock price of Gujarat Industries Power Co Ltd.

View full answer

Who are in the management team of Guj Inds. Power?

14-Aug-2026

The management team of Guj Inds. Power includes A K Rakesh (Chairman), Vasudeva Vatsala (Executive Director & Managing Director), and several Non-Executive and Independent Directors such as Jai Prakash Shivahare, Swaroop P, and N N Misra.

The management team of Guj Inds. Power includes the following members:<BR><BR>1. **A K Rakesh** - Chairman / Non-Executive Director<BR>2. **Jai Prakash Shivahare** - Non-Executive Director / Nominee<BR>3. **Swaroop P** - Non-Executive Director / Nominee<BR>4. **Manisha Chandra** - Non-Executive Director / Nominee<BR>5. **N N Misra** - Independent Non-Executive Director<BR>6. **Prabhat Singh** - Independent Non-Executive Director<BR>7. **Nitin Shukla** - Independent Non-Executive Director<BR>8. **Ravindra Dholakia** - Independent Non-Executive Director<BR>9. **Mamata Biswal** - Independent Non-Executive Director<BR>10. **Vasudeva Vatsala** - Executive Director & Managing Director<BR><BR>If you need more specific information about any of these individuals or their roles, feel free to ask!

View full answer

What does Guj Inds. Power do?

14-Aug-2026

Gujarat Industries Power Company Limited (GIPCL) generates power from gas, lignite, wind, and solar sources. As of June 2026, it reported net sales of ₹499 Cr and a net profit of ₹158 Cr, with a market cap of ₹2,666 Cr.

Overview:<BR>Gujarat Industries Power Company Limited (GIPCL) is engaged in the generation of power from gas, lignite, wind, and solar, operating within the small-cap power industry.<BR><BR>History:<BR>GIPCL was established in June 1985. The latest quarterly results reported net sales and net profit for June 2026.<BR><BR>Financial Snapshot:<BR>Net Sales: 499 Cr (Quarterly Results - Jun 2026) <BR>Net Profit: 158 Cr (Quarterly Results - Jun 2026) <BR>Market Cap: INR 2,666 Cr (Small Cap)<BR><BR>Key Metrics:<BR>P/E: 5.00 <BR>Industry P/E: 22 <BR>Dividend Yield: 2.30% <BR>Debt-Equity: 0.87 <BR>Return on Equity: 13.09% <BR>Price to Book: 0.70 <BR><BR>Contact Details:<BR>Address: P O Ranoli, Vadodara Gujarat: 391350 <BR>Phone: 91-0265-2232768 <BR>Email: investors@gipcl.com <BR>Website: http://www.gipcl.com

View full answer

Who are the peers of the Guj Inds. Power?

14-Aug-2026

Peers of Guj Inds. Power include PTC India, RattanIndia Power, Ujaas Energy, and others. Guj Inds. Power has below average management and growth risk, with a good capital structure and a 1-year return of -6.66%.

Peers: The peers of Guj Inds. Power are PTC India, RattanIndia Pow., Ujaas Energy, Reliance Infra., Insolation Ener, K.P. Energy, Orient Green, Sustainable Ener, and Vilas Transcore.<BR><BR>Quality Snapshot: Excellent management risk is observed at Insolation Ener, K.P. Energy, and the rest. Average management risk is found at PTC India, Ujaas Energy, Sustainable Ener, Vilas Transcore, and the rest. Below Average management risk is seen at RattanIndia Pow., Reliance Infra., Orient Green, Guj Inds. Power, and the rest. Growth is Excellent at Insolation Ener and K.P. Energy, while Average growth is noted at PTC India, Ujaas Energy, Sustainable Ener, Vilas Transcore, and the rest. Below Average growth is present at RattanIndia Pow., Reliance Infra., Orient Green, Guj Inds. Power, and the rest. Capital Structure is Good at Guj Inds. Power, Insolation Ener, K.P. Energy, while Average is seen at PTC India, and Below Average at RattanIndia Pow., Ujaas Energy, Reliance Infra., Orient Green, Sustainable Ener, and the rest.<BR><BR>Return Snapshot: Ujaas Energy has the highest 1-year return at N/A, while Reliance Infra. has the lowest at -73.52%, with Guj Inds. Power's 1-year return at -6.66% being higher than that of Reliance Infra. Negative six-month returns are noted for Reliance Infra., Insolation Ener, K.P. Energy, and the rest.

View full answer

How big is Guj Inds. Power?

14-Aug-2026

As of 14th August, Gujarat Industries Power Co Ltd has a market capitalization of 2,726.37 Cr, with recent net sales of 1,618.88 Cr and a net profit of 502.85 Cr.

As of 14th August, Gujarat Industries Power Co Ltd has a market capitalization of 2,726.37 Cr, classifying it as a Small Cap company.<BR><BR>In the latest four quarters, the company reported Net Sales of 1,618.88 Cr and a Net Profit of 502.85 Cr.<BR><BR>The latest annual period for the balance sheet is March 2019, with Shareholder's Funds amounting to 2,570.74 Cr and Total Assets of 3,831.38 Cr.

View full answer

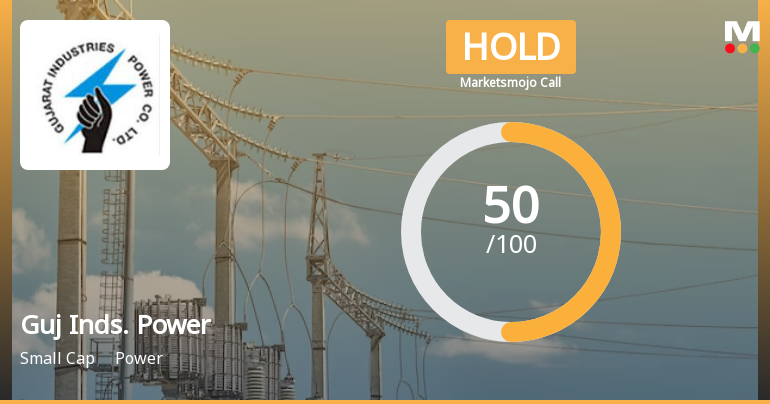
Should I buy, sell or hold Gujarat Industries Power Co Ltd?

13-Aug-2026

When is the next results date for Gujarat Industries Power Co Ltd?

04-Aug-2026

The next results date for Gujarat Industries Power Co Ltd is 11 August 2026.

The next results date for Gujarat Industries Power Co Ltd is scheduled for 11 August 2026.

View full answer

Are Gujarat Industries Power Co Ltd latest results good or bad?

30-May-2026

Gujarat Industries Power Co Ltd reported strong Q4 FY26 results with a net profit of ₹326.85 crore and revenue growth of 26.61% year-on-year. However, the profit was significantly boosted by a one-time tax credit, and rising interest expenses raise concerns about long-term sustainability.

Gujarat Industries Power Co Ltd (GIPCL) has reported its latest results for Q4 FY26, and the performance can be characterized as strong overall, although there are some underlying concerns.<BR><BR>The company achieved a net profit of ₹326.85 crore, a significant turnaround from a loss in the previous quarter, marking a remarkable increase of 368.65% year-on-year. Revenue also saw impressive growth, reaching ₹428.26 crore, which represents a 15.76% increase from the previous quarter and a 26.61% increase year-on-year. The operating margin improved to 45.53%, indicating enhanced operational efficiency.<BR><BR>However, it's important to note that the reported net profit was significantly boosted by an exceptional tax credit of ₹228.98 crore, which artificially inflated the earnings. Without this one-time benefit, the normalized profit would have been much lower, raising concerns about the sustainability of such high profitability levels. Additionally, interest expenses surged dramatically, increasing by nearly 599% year-on-year, which could signal rising financial stress.<BR><BR>In summary, while GIPCL's latest results show strong revenue growth and a return to profitability, the underlying financial pressures and reliance on non-operating income for profit raise questions about the long-term sustainability of this performance. Investors should keep an eye on these factors moving forward.

View full answer

How has been the historical performance of Guj Inds. Power?

13-Nov-2025

Guj Inds. Power has shown mixed historical performance, with net sales rising from 1,371.04 Cr in Mar'14 to 1,407.35 Cr in Mar'19, and profit after tax improving to 254.76 Cr in Mar'19. Despite some fluctuations in profit before tax, the company demonstrated resilience with increased operating profit and cash flow.

Answer:<BR>The historical performance of Guj Inds. Power shows a mixed trend in financial metrics over the years.<BR><BR>Breakdown:<BR>Guj Inds. Power's net sales increased from 1,371.04 Cr in Mar'14 to 1,407.35 Cr in Mar'19, with a notable rise from 1,353.84 Cr in Mar'18. Total operating income followed a similar pattern, peaking at 1,407.35 Cr in Mar'19. The company's operating profit (PBDIT) also saw an upward trend, reaching 664.96 Cr in Mar'19, up from 534.05 Cr in the previous year. Profit before tax fluctuated slightly, with a peak of 317.50 Cr in Mar'18 and a slight decline to 306.64 Cr in Mar'19. However, profit after tax improved to 254.76 Cr in Mar'19 from 244.52 Cr in Mar'18. The company's total assets grew from 2,992.37 Cr in Mar'14 to 3,831.38 Cr in Mar'19, while total liabilities also increased, reflecting a rise from 2,992.37 Cr to 3,831.38 Cr in the same period. Cash flow from operating activities significantly improved to 581.00 Cr in Mar'19, compared to 331.01 Cr in Mar'18, indicating a stronger cash generation capability. Overall, Guj Inds. Power has shown resilience in its financial performance with increasing sales, profits, and cash flow, despite fluctuations in certain areas.

View full answer

Is Guj Inds. Power technically bullish or bearish?

27-Oct-2025

As of October 24, 2025, Guj Inds. Power is in a bearish trend with moderate strength, indicated by bearish MACD and moving averages, despite a mildly bullish signal from Dow Theory, following a price decline from 190.40 to 182.55.

As of 24 October 2025, the technical trend for Guj Inds. Power has changed from mildly bearish to bearish. The current stance is bearish with moderate strength. Key indicators driving this include a bearish MACD on the weekly chart, bearish moving averages on the daily chart, and a bearish KST on the weekly chart. The Bollinger Bands also reflect a mildly bearish sentiment on both weekly and monthly time frames. Despite a mildly bullish indication from Dow Theory on the weekly chart, the overall technical picture remains bearish, particularly given the recent price decline from a previous close of 190.40 to a current price of 182.55.

View full answer

Is Guj Inds. Power overvalued or undervalued?

16-Sep-2025

As of September 15, 2025, Guj Inds. Power is fairly valued with a PE ratio of 14.58, an EV to EBITDA of 10.62, and a Price to Book Value of 0.83, positioning it reasonably within its sector but lagging behind peers like NTPC and Tata Power, and underperforming compared to the Sensex.

As of 15 September 2025, Guj Inds. Power has moved from an attractive to a fair valuation grade. The company appears to be fairly valued at this time. Key ratios include a PE ratio of 14.58, an EV to EBITDA of 10.62, and a Price to Book Value of 0.83, which indicate a moderate valuation relative to its earnings and asset base.<BR><BR>In comparison to peers, NTPC is rated attractive with a PE of 13.41, while Tata Power Co. also holds an attractive rating with a significantly higher PE of 30.06. This suggests that Guj Inds. Power is positioned reasonably within its sector, but there are more appealing options available. Additionally, the company's recent stock performance has lagged behind the Sensex, particularly in the year-to-date and one-year periods, which may further support the notion of a fair valuation.

View full answer

Who are the top shareholders of the Guj Inds. Power?

17-Jul-2025

The top shareholders of Guj Inds. Power include Gujarat Urja Vikas Nigam Limited with 24.73%, HDFC Trustee Company Ltd. at 4.08%, and various mutual funds and foreign institutional investors holding a combined 8.70%. Individual investors own 20.99% of the shares.

The top shareholders of Guj Inds. Power include several key players. The majority shareholder is Gujarat Urja Vikas Nigam Limited, which holds 24.73% of the shares. In addition, there are 7 mutual fund schemes collectively holding 4.67%, and 54 foreign institutional investors (FIIs) with a combined holding of 4.03%. The highest public shareholder is HDFC Trustee Company Ltd., representing the HDFC Balanced Advantage Fund, which holds 4.08%. Individual investors collectively own 20.99% of the shares.

View full answer

Has Guj Inds. Power declared dividend?

06-Jun-2025

Yes, Gujarat Industries Power Co Ltd has declared a 39% dividend, amounting to ₹3.9 per share, with an ex-date of September 13, 2024. The company has shown strong total returns over various periods, particularly in the long term.

Gujarat Industries Power Co Ltd has declared a 39% dividend.<BR><BR>Dividend Details:<BR>- Percentage announced: 39%<BR>- Amount per share: 3.9<BR>- Ex-date: 13 Sep 24<BR><BR>Dividend Yield: 1.92%.<BR><BR>Total Returns by Period:<BR>In the 6-month period, the price return was -6.69%, with a dividend return of 0%, resulting in a total return of -6.69%.<BR><BR>For the 1-year period, the price return was 1.33%, the dividend return was 1.77%, leading to a total return of 3.1%.<BR><BR>Over the 2-year period, the price return reached 105.36%, the dividend return was 7.88%, culminating in a total return of 113.24%.<BR><BR>In the 3-year period, the price return was 132.34%, with a dividend return of 13.59%, resulting in a total return of 145.93%.<BR><BR>For the 4-year period, the price return was 141.55%, the dividend return was 15.43%, leading to a total return of 156.98%.<BR><BR>In the 5-year period, the price return was 224.24%, with a dividend return of 21.91%, resulting in a total return of 246.15%.<BR><BR>Overall, Gujarat Industries Power Co Ltd has declared a substantial dividend, and the total returns over various periods indicate strong performance, particularly over the longer term, suggesting a positive investment outlook.

View full answer
iScoreScore
Click here to find our call on this stock
Strong Sell
Sell
Hold
Buy
Strong Buy

Dashboard

1

Weak Long Term Fundamental Strength with an average Return on Capital Employed (ROCE) of 5.98%

  • Poor long term growth as Net Sales has grown by an annual rate of 4.56% and Operating profit at 6.90% over the last 5 years
2

Positive results in Jun 26

3

With ROCE of 3.6, it has a Attractive valuation with a 0.9 Enterprise value to Capital Employed

4

Falling Participation by Institutional Investors

stock-summaryMojo Parameters

Mojo Parameters

Loading Valuation Snapshot...

Stock DNA

stock-summary
Industry

Power

stock-summary
Market cap

INR 3,150 Cr (Small Cap)

stock-summary
P/E

6.00

stock-summary
Industry P/E

22

stock-summary
Dividend Yield

2.00%

stock-summary
Debt Equity

0.87

stock-summary
Return on Equity

13.09%

stock-summary
Price to Book

0.81

Revenue and Profits:
Net Sales:
499 Cr
(Quarterly Results - Jun 2026)
Net Profit:
158 Cr
stock-summaryTotal Returns
Total Returns (Price + Dividend) stock-summary
Dividend Yield (2%)
TimePeriod
Price Return
Dividend Return
Total Return
3 Months
28.61%
2.51%
31.12%
6 Months
43.63%
3.02%
46.65%
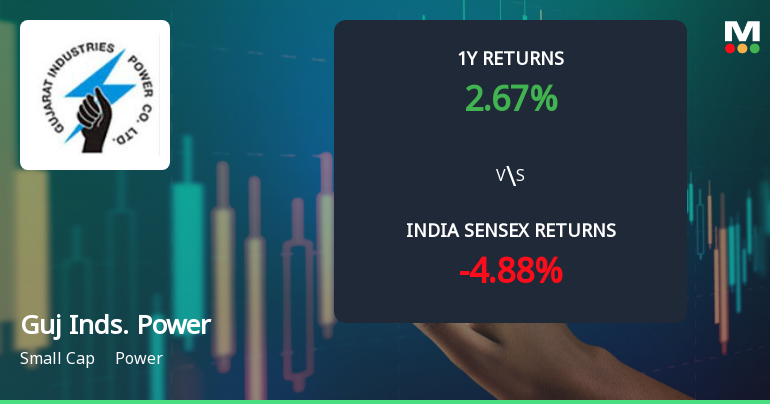
1 Year
11.57%
4.41%
15.98%
2 Years
-17.13%
5.17%
-11.96%
3 Years
70.62%
9.47%
80.09%
4 Years
126.0%
16.96%
142.96%
5 Years
147.95%
22.69%
170.64%

Latest dividend: 4 per share ex-dividend date: Sep-12-2025

Risk Adjusted Returns v/s stock-summary
Returns Beta
Icon
Beta has not been calculated since enough price history is not available
stock-summaryNews & Corporate Actions

Announcements stock-summary

Announcement under Regulation 30 (LODR)-Newspaper Publication

25-Aug-2026 | Source : BSE

Pursuant to Regulation 47 of the SEBI LODR Regulations 2015 intimation regarding newspaper publication containing details of 41st AGM Book Closure e-voting etc.

Business Responsibility and Sustainability Reporting (BRSR)

24-Aug-2026 | Source : BSE

GIPCL: Business Responsibility and Sustainability Report for the FY 2025-26

Intimation Regarding Book Closure And Record Date

24-Aug-2026 | Source : BSE

GIPCL: Intimation regarding Book Closure and Records Date for entitlement of Dividend

Corporate Actions stock-summary

stock-summary
BOARD MEETING

No Upcoming Board Meetings

stock-summary
DIVIDEND

Gujarat Industries Power Co Ltd has declared 41% dividend, ex-date: 11 Sep 26

stock-summary
SPLITS

No Splits history available

stock-summary
BONUS

No Bonus history available

stock-summary
RIGHTS

No Rights history available

stock-summaryKey Factors

Quality key factors stock-summary

Factor
Value
Sales Growth (5y)
4.56%
EBIT Growth (5y)
6.90%
EBIT to Interest (avg)
6.23
Debt to EBITDA (avg)
2.14
Net Debt to Equity (avg)
0.87
Sales to Capital Employed (avg)
0.36
Tax Ratio
Tax Ratio is Negative%
Dividend Payout Ratio
30.03%
Pledged Shares
0
Institutional Holding
9.31%
ROCE (avg)
7.94%
ROE (avg)
6.94%

Valuation key factors

Factor
Value
P/E Ratio
6
Industry P/E
22
Price to Book Value
0.81
EV to EBIT
18.73
EV to EBITDA
9.65
EV to Capital Employed
0.90
EV to Sales
3.98
PEG Ratio
0.04
Dividend Yield
2.00%
ROCE (Latest)
3.63%
ROE (Latest)
13.09%

Technicals key factors

Indicator
Weekly
Monthly
MACD
Bullish
Mildly Bullish
RSI
No Signal
No Signal
Bollinger Bands
Bullish
Bullish
Moving Averages
Bullish (Daily)
KST
Bullish
Bearish
Dow Theory
Mildly Bullish
Mildly Bullish
OBV
Bullish
Bullish
stock-summary Technical Indicator Scale: Bearish, Mildly Bearish, Sideways, Mildly Bullish, Bullish  Turned 
stock-summaryShareholding
Shareholding Snapshot : Jun 2026stock-summary
Shareholding Compare (%holding) stock-summary
Majority shareholders

Promoters

Pledged Promoter Holdings

None

Mutual Funds

Held by 5 Schemes (4.37%)

FIIs

Held by 38 FIIs (2.89%)

Promoter with highest holding

Gujarat Urja Vikas Nigam Limited (24.73%)

Highest Public shareholder

Hdfc Trustee Company Ltd. A/c Hdfc Balanced Advantage Fund (4.08%)

Individual Investors Holdings

22.03%

stock-summaryFinancial
[
  {
    "link": "quarterly",
    "btn_text": "All Quarterly Results",
    "header": "Quarterly Results Snapshot (Standalone) - Jun'26 - QoQ",
    "rhs": [
      {
        "prefix": "Net Sales ",
        "suffix": "QoQ Growth in quarter ended Jun 2026 is 16.58% vs 15.76% in Mar 2026",
        "dir": 1
      },
      {
        "prefix": "Standalone Net Profit ",
        "suffix": "QoQ Growth in quarter ended Jun 2026 is -51.69% vs 10,314.06% in Mar 2026",
        "dir": -1
      }
    ],
    "table": {
      "header": [
        "Jun'26",
        "Mar'26",
        "Change(%)"
      ],
      "body": [
        {
          "field": "Net Sales",
          "val1": "499.28",
          "val2": "428.26",
          "chgp": "16.58%",
          "chgp_class": "positive"
        },
        {
          "field": "Operating Profit (PBDIT) excl Other Income",
          "val1": "241.64",
          "val2": "194.99",
          "chgp": "23.92%",
          "chgp_class": "positive"
        },
        {
          "field": "Interest",
          "val1": "51.09",
          "val2": "49.48",
          "chgp": "3.25%",
          "chgp_class": "negative"
        },
        {
          "field": "Exceptional Items",
          "val1": "0.00",
          "val2": "0.00",
          "chgp": "",
          "chgp_class": "neutral"
        },
        {
          "field": "Standalone Net Profit",
          "val1": "157.90",
          "val2": "326.85",
          "chgp": "-51.69%",
          "chgp_class": "negative"
        },
        {
          "field": "Operating Profit Margin (Excl OI)",
          "val1": "48.40%",
          "val2": "45.53%",
          "chgp": "2.87%",
          "chgp_class": "positive"
        }
      ]
    }
  },
  {
    "link": "half-yearly",
    "btn_text": "All Half Yearly Results",
    "header": "Half Yearly Results Snapshot (Standalone) - Sep'25",
    "rhs": [
      {
        "prefix": "Net Sales ",
        "suffix": " Growth in half year ended Sep 2025 is 16.26% vs -4.24% in Sep 2024",
        "dir": 1
      },
      {
        "prefix": "Standalone Net Profit ",
        "suffix": " Growth in half year ended Sep 2025 is -23.16% vs 19.58% in Sep 2024",
        "dir": -1
      }
    ],
    "table": {
      "header": [
        "Sep'25",
        "Sep'24",
        "Change(%)"
      ],
      "body": [
        {
          "field": "Net Sales",
          "val1": "692.92",
          "val2": "596.02",
          "chgp": "16.26%",
          "chgp_class": "positive"
        },
        {
          "field": "Operating Profit (PBDIT) excl Other Income",
          "val1": "220.44",
          "val2": "197.40",
          "chgp": "11.67%",
          "chgp_class": "positive"
        },
        {
          "field": "Interest",
          "val1": "25.09",
          "val2": "17.00",
          "chgp": "47.59%",
          "chgp_class": "negative"
        },
        {
          "field": "Exceptional Items",
          "val1": "0.00",
          "val2": "0.00",
          "chgp": "",
          "chgp_class": "neutral"
        },
        {
          "field": "Standalone Net Profit",
          "val1": "78.76",
          "val2": "102.50",
          "chgp": "-23.16%",
          "chgp_class": "negative"
        },
        {
          "field": "Operating Profit Margin (Excl OI)",
          "val1": "31.81%",
          "val2": "33.12%",
          "chgp": "-1.31%",
          "chgp_class": "negative"
        }
      ]
    }
  },
  {
    "link": "nine-monthly",
    "btn_text": "All Nine Monthly Results",
    "header": "Nine Monthly Results Snapshot (Standalone) - Dec'25",
    "rhs": [
      {
        "prefix": "Net Sales ",
        "suffix": "YoY Growth in nine months ended Dec 2025 is 15.78% vs -5.94% in Dec 2024",
        "dir": 1
      },
      {
        "prefix": "Standalone Net Profit ",
        "suffix": "YoY Growth in nine months ended Dec 2025 is -46.68% vs 7.07% in Dec 2024",
        "dir": -1
      }
    ],
    "table": {
      "header": [
        "Dec'25",
        "Dec'24",
        "Change(%)"
      ],
      "body": [
        {
          "field": "Net Sales",
          "val1": "1,062.86",
          "val2": "918.01",
          "chgp": "15.78%",
          "chgp_class": "positive"
        },
        {
          "field": "Operating Profit (PBDIT) excl Other Income",
          "val1": "342.77",
          "val2": "286.85",
          "chgp": "19.49%",
          "chgp_class": "positive"
        },
        {
          "field": "Interest",
          "val1": "61.23",
          "val2": "24.86",
          "chgp": "146.30%",
          "chgp_class": "negative"
        },
        {
          "field": "Exceptional Items",
          "val1": "0.00",
          "val2": "0.00",
          "chgp": "",
          "chgp_class": "neutral"
        },
        {
          "field": "Standalone Net Profit",
          "val1": "75.56",
          "val2": "141.70",
          "chgp": "-46.68%",
          "chgp_class": "negative"
        },
        {
          "field": "Operating Profit Margin (Excl OI)",
          "val1": "32.25%",
          "val2": "31.25%",
          "chgp": "1.00%",
          "chgp_class": "positive"
        }
      ]
    }
  },
  {
    "link": "annual",
    "btn_text": "All Annual Results",
    "header": "Annual Results Snapshot (Standalone) - Mar'26",
    "rhs": [
      {
        "prefix": "Net Sales ",
        "suffix": "YoY Growth in year ended Mar 2026 is 18.70% vs -6.85% in Mar 2025",
        "dir": 1
      },
      {
        "prefix": "Standalone Net Profit ",
        "suffix": "YoY Growth in year ended Mar 2026 is 90.33% vs 6.51% in Mar 2025",
        "dir": 1
      }
    ],
    "table": {
      "header": [
        "Mar'26",
        "Mar'25",
        "Change(%)"
      ],
      "body": [
        {
          "field": "Net Sales",
          "val1": "1,491.12",
          "val2": "1,256.26",
          "chgp": "18.70%",
          "chgp_class": "positive"
        },
        {
          "field": "Operating Profit (PBDIT) excl Other Income",
          "val1": "537.76",
          "val2": "406.14",
          "chgp": "32.41%",
          "chgp_class": "positive"
        },
        {
          "field": "Interest",
          "val1": "110.71",
          "val2": "31.93",
          "chgp": "246.73%",
          "chgp_class": "negative"
        },
        {
          "field": "Exceptional Items",
          "val1": "0.00",
          "val2": "0.00",
          "chgp": "",
          "chgp_class": "neutral"
        },
        {
          "field": "Standalone Net Profit",
          "val1": "402.41",
          "val2": "211.43",
          "chgp": "90.33%",
          "chgp_class": "positive"
        },
        {
          "field": "Operating Profit Margin (Excl OI)",
          "val1": "36.06%",
          "val2": "32.33%",
          "chgp": "3.73%",
          "chgp_class": "positive"
        }
      ]
    }
  }
]

Quarterly Results Snapshot (Standalone) - Jun'26 - QoQstock-summary

Jun'26
Mar'26
Change(%)
Net Sales
499.28
428.26
16.58%
Operating Profit (PBDIT) excl Other Income
241.64
194.99
23.92%
Interest
51.09
49.48
3.25%
Exceptional Items
0.00
0.00
Standalone Net Profit
157.90
326.85
-51.69%
Operating Profit Margin (Excl OI)
48.40%
45.53%
2.87%
Values in Rs Cr.
Direction Arrows
Net Sales

QoQ Growth in quarter ended Jun 2026 is 16.58% vs 15.76% in Mar 2026

Direction Arrows
Standalone Net Profit

QoQ Growth in quarter ended Jun 2026 is -51.69% vs 10,314.06% in Mar 2026

Half Yearly Results Snapshot (Standalone) - Sep'25stock-summary

Sep'25
Sep'24
Change(%)
Net Sales
692.92
596.02
16.26%
Operating Profit (PBDIT) excl Other Income
220.44
197.40
11.67%
Interest
25.09
17.00
47.59%
Exceptional Items
0.00
0.00
Standalone Net Profit
78.76
102.50
-23.16%
Operating Profit Margin (Excl OI)
31.81%
33.12%
-1.31%
Values in Rs Cr.
Direction Arrows
Net Sales

Growth in half year ended Sep 2025 is 16.26% vs -4.24% in Sep 2024

Direction Arrows
Standalone Net Profit

Growth in half year ended Sep 2025 is -23.16% vs 19.58% in Sep 2024

Nine Monthly Results Snapshot (Standalone) - Dec'25stock-summary

Dec'25
Dec'24
Change(%)
Net Sales
1,062.86
918.01
15.78%
Operating Profit (PBDIT) excl Other Income
342.77
286.85
19.49%
Interest
61.23
24.86
146.30%
Exceptional Items
0.00
0.00
Standalone Net Profit
75.56
141.70
-46.68%
Operating Profit Margin (Excl OI)
32.25%
31.25%
1.00%
Values in Rs Cr.
Direction Arrows
Net Sales

YoY Growth in nine months ended Dec 2025 is 15.78% vs -5.94% in Dec 2024

Direction Arrows
Standalone Net Profit

YoY Growth in nine months ended Dec 2025 is -46.68% vs 7.07% in Dec 2024

Annual Results Snapshot (Standalone) - Mar'26stock-summary

Mar'26
Mar'25
Change(%)
Net Sales
1,491.12
1,256.26
18.70%
Operating Profit (PBDIT) excl Other Income
537.76
406.14
32.41%
Interest
110.71
31.93
246.73%
Exceptional Items
0.00
0.00
Standalone Net Profit
402.41
211.43
90.33%
Operating Profit Margin (Excl OI)
36.06%
32.33%
3.73%
Values in Rs Cr.
Direction Arrows
Net Sales

YoY Growth in year ended Mar 2026 is 18.70% vs -6.85% in Mar 2025

Direction Arrows
Standalone Net Profit

YoY Growth in year ended Mar 2026 is 90.33% vs 6.51% in Mar 2025

stock-summaryCompany CV
About Gujarat Industries Power Co Ltd stock-summary
stock-summary
Gujarat Industries Power Co Ltd
Small Cap
Power
Gujarat Industries Power Company Limited (GIPCL), established in June, 1985 is one of the "Panchratnas" (five jewels), in Gujarat. The Company is engaged in generation of power from gas, lignite, wind and solar in Gujarat. Their power stations include Vadodara Station-I, which is a 145 mega watt combined cycle power plant (CCPP); Vadodara Station- II, which is a 165 mega watt CCPP, and Surat Lignite Power Plant (SLPP). The total present capacity of Vadodara and Mangrol plants is 810 MW.
Company Coordinates stock-summary
Company Details
P O Ranoli , Vadodara Gujarat : 391350
stock-summary
Tel: 91-0265-2232768
stock-summary
investors@gipcl.com
Registrar Details
Link Intime India Pvt Ltd., B-102 & B103, Shangrila Complex, First Floor, Opp: HDFC Bank, Near Radhakrishna Char Rasta, Akota, Vadodara