Reliance Infra.

INR
61.58
0.51 (0.84%)
BSENSE

Aug 27, 03:22 PM

BSE+NSE Vol: 2.31 lacs

  • Price Points
  • Score
  • Mojo Parameters
  • Total Return
  • News and Corporate Actions
  • Key factors
  • Shareholding
  • Financials
  • CompanyCV
stock-summaryPrice Point
High/Low

1Day

52 Week

Valuation
Technical
Day's Volume

CASH

2.31 lacs (-54.73%) Volume

Shareholding (Jun 2026)

FII

4.95%

Held by 128 FIIs

DII

0.78%

Held by 7 DIIs

Promoter

19.05%

Why is Reliance Infrastructure Ltd falling/rising?

27-Aug-2026

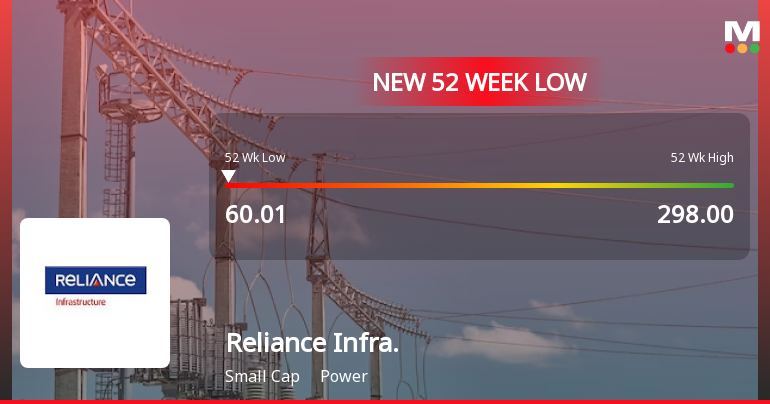
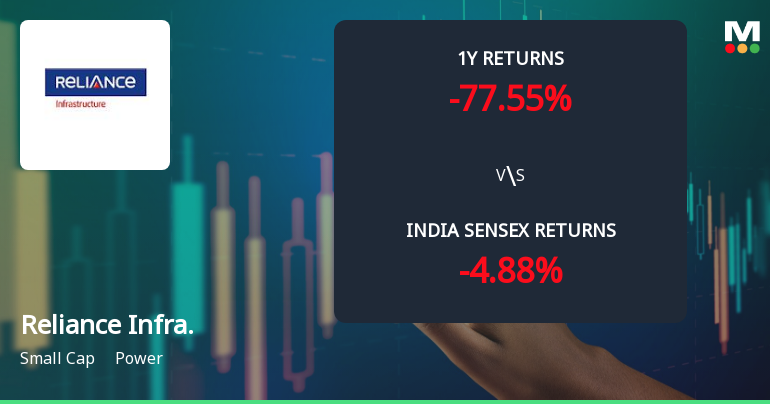
As of 26-Aug, Reliance Infrastructure Ltd's stock price is declining, currently at Rs 61.07, reflecting a significant underperformance with a 1-year return of -77.16% and weak financial fundamentals, including a high Debt to EBITDA ratio and disappointing recent results. Investor confidence is waning, evidenced by a 60.91% drop in delivery volume and a reduction in institutional stakes.

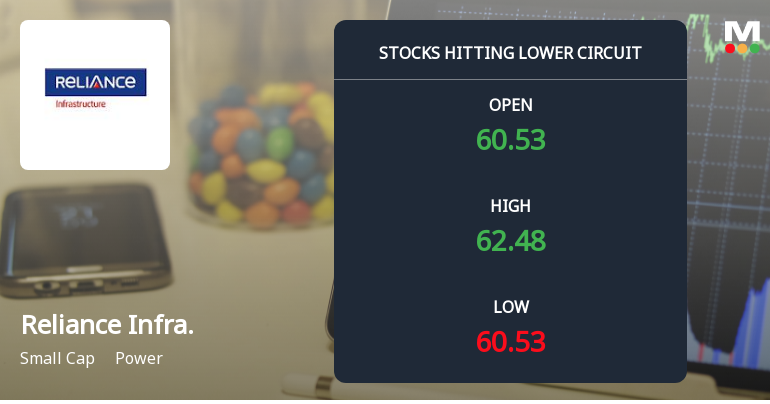
As of 26-Aug, Reliance Infrastructure Ltd's stock price is falling, currently at Rs 61.07, reflecting a decrease of Rs 0.69 or 1.12%. The stock has been on a downward trend, having lost 2.44% over the last three days and is now just 1.74% away from its 52-week low of Rs 60.43. <BR><BR>In terms of performance, the stock has significantly underperformed compared to the broader market, with a 1-year return of -77.16% against a -4.10% return for the Sensex. Furthermore, over the past three years, the stock has declined by 65.44%, while the Sensex has gained 19.40%. This poor performance is compounded by weak long-term fundamentals, including an operating profit growth rate of only 2.02% over the last five years and a high Debt to EBITDA ratio of 4.92 times, indicating low ability to service debt.<BR><BR>Recent financial results have also been disappointing, with the company reporting an operating cash flow of Rs 2,550.22 crore, the lowest in the year, and a profit after tax that has decreased by 58.15% over the last six months. Additionally, the company has recorded a negative EBIT of Rs -822.28 crore, further highlighting its financial struggles. <BR><BR>Investor participation is declining, with a significant drop in delivery volume by 60.91% compared to the five-day average, and institutional investors have reduced their stake by 1.06% in the previous quarter. This lack of confidence from institutional investors, who typically have more resources to analyze company fundamentals, adds to the stock's negative outlook. Overall, the combination of poor financial performance, declining investor interest, and weak long-term growth prospects are contributing to the falling stock price of Reliance Infrastructure Ltd.

View full answer

Should I buy, sell or hold Reliance Infrastructure Ltd?

16-Aug-2026

Who are in the management team of Reliance Infra.?

14-Aug-2026

The management team of Reliance Infra includes Vice Chairman Sateesh Seth, Executive Director & CEO Punit Garg, Company Secretary Paresh Rathod, and four Independent Directors: S S Kohli, K Ravi Kumar, Manari Kacker, and Chhaya Virani.

The management team of Reliance Infra includes the following individuals:<BR><BR>1. Sateesh Seth - Vice Chairman<BR>2. Punit Garg - Executive Director & CEO<BR>3. Paresh Rathod - Company Secretary & Compliance Officer<BR>4. S S Kohli - Independent Director<BR>5. K Ravi Kumar - Independent Director<BR>6. Manari Kacker - Independent Director<BR>7. Chhaya Virani - Independent Director<BR><BR>If you have any more questions about the company or its operations, feel free to ask!

View full answer

What does Reliance Infra. do?

14-Aug-2026

Reliance Infrastructure Ltd operates in the power industry as a small-cap company, with recent net sales of ₹4,001 Cr and a net profit of ₹918 Cr for March 2026. The company, formerly known as BSES, has a market cap of ₹2,787 Cr and key metrics include a P/E of 1.00 and a debt-equity ratio of 0.14.

Overview: <BR>Reliance Infrastructure Ltd operates in the power industry and is categorized as a small-cap company.<BR><BR>History: <BR>The company was incorporated in October 1929 under the name 'Bombay Suburban Electric Supply Limited (BSES)', later changing to BSES Limited. It was renamed Reliance Energy Limited on February 24, 2004, and subsequently became Reliance Infrastructure Limited on April 28, 2008. The most recent quarterly results reported net sales and net profit for March 2026.<BR><BR>Financial Snapshot: <BR>Most recent Net Sales: 4,001 Cr (Quarterly Results - Mar 2026) <BR>Most recent Net Profit: 918 Cr (Quarterly Results - Mar 2026) <BR>Market-cap value: INR 2,787 Cr (Small Cap)<BR><BR>Key Metrics: <BR>P/E: 1.00 <BR>Industry P/E: 22 <BR>Dividend Yield: 0.00% <BR>Debt-Equity: 0.14 <BR>Return on Equity: 10.44% <BR>Price to Book: 0.16 <BR><BR>Contact Details: <BR>Address: Reliance Centre Ground Floor, 19 Walchand Hirachand Marg Mumbai Maharashtra : 400001 <BR>Tel: 91-022-43031000 <BR>Email: rinfra.investor@relianceada.com <BR>Website: http://www.rinfra.com

View full answer

Who are the peers of the Reliance Infra.?

14-Aug-2026

Peers of Reliance Infra. include KPI Green Energy, PTC India, RattanIndia Power, and others. Reliance Infra. shows below-average management and growth risks, with a significant 1-year return decline of -73.52%, underperforming compared to its peers.

Peers: The peers of Reliance Infra. are KPI Green Energy, PTC India, RattanIndia Pow., Ujaas Energy, Guj Inds. Power, Insolation Ener, K.P. Energy, Orient Green, and Sustainable Ener.<BR><BR>Quality Snapshot: Excellent management risk is observed at KPI Green Energy, Insolation Ener, and K.P. Energy, while Average management risk is found at PTC India, Ujaas Energy, and the rest. Below Average management risk is noted for RattanIndia Pow., Reliance Infra., Guj Inds. Power, Orient Green, and Sustainable Ener. In terms of Growth, Excellent growth is seen at KPI Green Energy and Insolation Ener, while Average growth is found at PTC India, Ujaas Energy, K.P. Energy, and the rest. Below Average growth is present in RattanIndia Pow., Reliance Infra., Guj Inds. Power, Orient Green, and Sustainable Ener. For Capital Structure, Good capital structure is noted at Guj Inds. Power, Insolation Ener, and K.P. Energy, while Below Average capital structure is observed at KPI Green Energy, PTC India, RattanIndia Pow., Ujaas Energy, Reliance Infra., Orient Green, and Sustainable Ener.<BR><BR>Return Snapshot: The peer with the highest 1-year return is Guj Inds. Power at -6.66%, while Reliance Infra. has the lowest 1-year return at -73.52%. This indicates that Reliance Infra. significantly underperforms compared to its peers. Additionally, the six-month return is negative for Reliance Infra., PTC India, Insolation Ener, K.P. Energy, Orient Green, and Sustainable Ener.

View full answer

Are Reliance Infrastructure Ltd latest results good or bad?

14-Aug-2026

Reliance Infrastructure Ltd's latest Q4 FY26 results are concerning, showing a net profit increase due to exceptional items but a 79.07% decline year-on-year, alongside falling sales and negative operating margins. Overall, the operational struggles suggest caution for investors.

Reliance Infrastructure Ltd's latest results for Q4 FY26 present a mixed picture, but overall, they lean towards the negative side. <BR><BR>On one hand, the company reported a consolidated net profit of ₹918.07 crores, which is a staggering increase of 8,156.03% quarter-on-quarter. However, this figure is misleading as it was significantly bolstered by exceptional items and tax adjustments rather than strong operational performance. In fact, the net profit reflects a sharp decline of 79.07% year-on-year.<BR><BR>The operational metrics tell a different story. The company's net sales fell by 6.87% quarter-on-quarter to ₹4,001.28 crores, marking the lowest revenue in the past eight quarters. Year-on-year, sales also contracted by 2.60%. Furthermore, the operating margin (excluding other income) plummeted to -18.02%, the worst performance in eight quarters, indicating severe cost pressures and operational challenges.<BR><BR>Additionally, the company's return on equity of 24.29% appears strong but is primarily a result of the exceptional profits recorded in the latest quarter, rather than sustainable operational success. The significant decline in operating profit before depreciation, interest, and tax (PBDIT) to -₹720.98 crores raises concerns about the viability of its business model.<BR><BR>Overall, while the headline profit figure may seem impressive, the underlying operational struggles, declining sales, and negative margins suggest that the results are more concerning than positive. Investors should be cautious and closely monitor the company's performance in the coming quarters.

View full answer

How big is Reliance Infra.?

14-Aug-2026

As of 14th August, Reliance Infrastructure Ltd has a market capitalization of 2,731.70 Cr, with recent net sales of 20,440.53 Cr and a net profit of 2,900.22 Cr. The company's total assets are valued at 71,159.98 Cr.

As of 14th August, Reliance Infrastructure Ltd has a market capitalization of 2,731.70 Cr, categorizing it as a Small Cap company.<BR><BR>For the latest four quarters, the company reported Net Sales of 20,440.53 Cr and a Net Profit of 2,900.22 Cr.<BR><BR>The latest annual period for the balance sheet is March 2026, with Shareholder's Funds amounting to 17,872.52 Cr and Total Assets valued at 71,159.98 Cr.

View full answer

When is the next results date for Reliance Infrastructure Ltd?

12-Aug-2026

The next results date for Reliance Infrastructure Ltd is 14 August 2026.

The next results date for Reliance Infrastructure Ltd is scheduled for 14 August 2026.

View full answer

How has been the historical performance of Reliance Infra.?

13-Nov-2025

Reliance Infra has shown significant recovery, with net sales increasing from ₹18,411.10 crore in March 2022 to ₹23,591.88 crore in March 2025, and profit after tax turning positive at ₹8,490.11 crore. The company's financial position is stable, with total assets and liabilities both at ₹65,840.64 crore and positive cash flow from operating activities at ₹3,656.00 crore.

Answer:<BR>The historical performance of Reliance Infra shows a significant recovery in recent years, particularly in the fiscal year ending March 2025.<BR><BR>Breakdown:<BR>Reliance Infra's net sales have shown a steady increase, rising from 18,411.10 crore in March 2022 to 23,591.88 crore in March 2025. The total operating income followed a similar trend, reaching 23,591.88 crore in March 2025, up from 18,411.10 crore in March 2022. The company's operating profit (PBDIT) also improved significantly, climbing to 4,163.86 crore in March 2025 from 2,549.14 crore in March 2022. This led to a remarkable profit before tax of 8,483.88 crore in March 2025, a stark contrast to the losses recorded in the previous years. The profit after tax turned positive at 8,490.11 crore in March 2025, compared to losses in the preceding years. The earnings per share (EPS) reflected this positive trend, reaching 124.63 in March 2025 after being negative in the previous years. On the balance sheet, total liabilities increased to 65,840.64 crore in March 2025, while total assets also rose to the same figure, indicating a stable financial position. The cash flow from operating activities remained positive at 3,656.00 crore in March 2025, contributing to a net cash inflow of 673.00 crore for the year. Overall, Reliance Infra's financial performance has shown a strong recovery and growth trajectory in the latest fiscal year.

View full answer

How has been the historical performance of Reliance Infra.?

12-Nov-2025

Reliance Infra has experienced significant fluctuations historically but showed a strong recovery in the latest fiscal year, with net sales rising to 23,591.88 crore and profit after tax turning positive at 8,490.11 crore in March 2025. The company's financial position improved, reflected in a positive earnings per share of 124.63 and stable cash flow.

Answer:<BR>The historical performance of Reliance Infra shows significant fluctuations in key financial metrics over the years, culminating in a notable recovery in the latest fiscal year.<BR><BR>Breakdown:<BR>Reliance Infra's net sales have shown a consistent upward trend, increasing from 18,411.10 crore in March 2022 to 23,591.88 crore in March 2025. Total operating income followed a similar trajectory, reaching 23,591.88 crore in March 2025, up from 18,411.10 crore in March 2022. The company's operating profit (PBDIT) also improved significantly, rising to 4,163.86 crore in March 2025 from 2,549.14 crore in March 2022. This led to a remarkable profit before tax of 8,483.88 crore in March 2025, a stark contrast to the losses reported in previous years. Profit after tax turned positive at 8,490.11 crore in March 2025, compared to losses in the preceding years. The earnings per share (EPS) reflected this recovery, soaring to 124.63 in March 2025 from a negative EPS in the prior years. On the balance sheet, total liabilities increased to 65,840.64 crore in March 2025, while total assets also rose to the same figure, indicating a stable financial position. Cash flow from operating activities remained positive at 3,656.00 crore in March 2025, contributing to a net cash inflow of 673.00 crore for the year. Overall, the financial performance of Reliance Infra has shown a significant turnaround, particularly in the latest fiscal year.

View full answer

Is Reliance Infra. technically bullish or bearish?

30-Sep-2025

As of 29 September 2025, Reliance Infra's technical trend has shifted to bearish, supported by negative indicators from MACD, moving averages, Bollinger Bands, KST, OBV, and RSI.

As of 29 September 2025, the technical trend for Reliance Infra has changed from mildly bearish to bearish. The current technical stance is bearish with a strong indication of weakness. The weekly MACD is bearish, and the daily moving averages confirm this bearish sentiment. Bollinger Bands are also indicating a bearish trend on both weekly and monthly time frames. The KST and OBV show bearish signals on the weekly chart, while the monthly indicators are mildly bearish. Overall, the lack of bullish signals in the RSI further supports the bearish outlook.

View full answer

Who are the top shareholders of the Reliance Infra.?

17-Jul-2025

The top shareholders of Reliance Infra include Risee Infinity Private Limited with 18.87%, Authum Investment & Infrastructure Limited with 10.55%, and individual investors holding 41.77%. Additionally, foreign institutional investors hold 11.01%, while mutual funds have a combined stake of 0.2%.

The top shareholders of Reliance Infra include a mix of institutional and individual investors. The largest promoter is Risee Infinity Private Limited, holding 18.87%. Among public shareholders, Authum Investment & Infrastructure Limited is the highest with a 10.55% stake. Additionally, individual investors collectively hold 41.77% of the shares. The company also has 293 foreign institutional investors (FIIs) holding 11.01% of the shares, while mutual funds are represented by 35 schemes with a combined holding of 0.2%.

View full answer

Is Reliance Infra overvalued or undervalued?

09-Jun-2025

As of November 18, 2024, Reliance Infra is considered very attractive and undervalued with a low PE ratio of 3.84, significantly outperforming peers like NTPC and Power Grid, and achieving a remarkable 126.53% return over the past year.

As of 18 November 2024, the valuation grade for Reliance Infra has moved from attractive to very attractive, indicating a significant improvement in its perceived value. The company is currently considered undervalued, supported by a low PE ratio of 3.84, an EV to EBITDA ratio of 4.85, and a PEG ratio of just 0.01. These figures suggest that the stock is trading at a substantial discount compared to its earnings growth potential.<BR><BR>In comparison to its peers, Reliance Infra stands out with its very attractive valuation, especially when contrasted with NTPC, which has a PE ratio of 13.78, and Power Grid Corporation, which is deemed very expensive with a PE of 17.73. The strong performance of Reliance Infra is further highlighted by its impressive stock returns, significantly outpacing the Sensex over various periods, including a remarkable 126.53% return over the past year. This reinforces the notion that Reliance Infra is undervalued in the current market context.

View full answer

Has Reliance Infra declared dividend?

06-Jun-2025

Reliance Infrastructure Ltd has declared a 95% dividend, amounting to ₹9.5 per share, with an ex-date of September 12, 2018. Despite the dividend declaration, the yield is 0%, as recent returns have been driven solely by significant price appreciation.

Reliance Infrastructure Ltd has declared a 95% dividend.<BR><BR>Dividend Details:<BR>- Percentage announced: 95%<BR>- Amount per share: 9.5<BR>- Ex-date: 12 Sep 18<BR><BR>Dividend Yield: 0%<BR><BR>Total Returns by Period:<BR>In the 6-month period, the price return was 22.48%, the dividend return was 0%, resulting in a total return of 22.48%.<BR><BR>In the 1-year period, the price return was 134.62%, the dividend return was 0%, resulting in a total return of 134.62%.<BR><BR>In the 2-year period, the price return was 178.93%, the dividend return was 0%, resulting in a total return of 178.93%.<BR><BR>In the 3-year period, the price return was 251.71%, the dividend return was 0%, resulting in a total return of 251.71%.<BR><BR>In the 4-year period, the price return was 429.71%, the dividend return was 0%, resulting in a total return of 429.71%.<BR><BR>In the 5-year period, the price return was 1657.72%, the dividend return was 0%, resulting in a total return of 1657.72%.<BR><BR>Overall, while Reliance Infrastructure Ltd has declared a dividend, the dividend yield remains at 0%, indicating that the dividend does not contribute to the returns in recent periods. However, the price returns over the years have shown significant growth, suggesting strong performance in the stock price.

View full answer
iScoreScore
Click here to find our call on this stock
Strong Sell
Sell
Hold
Buy
Strong Buy

Dashboard

1

With a Operating Losses, the company has a Weak Long Term Fundamental Strength

  • Poor long term growth as Operating profit has grown by an annual rate 2.02% of over the last 5 years
  • Low ability to service debt as the company has a high Debt to EBITDA ratio of 4.92 times
2

Negative results in Jun 26

3

Risky - Negative Operating Profits

4

Falling Participation by Institutional Investors

5

Below par performance in long term as well as near term

stock-summaryMojo Parameters

Mojo Parameters

Loading Valuation Snapshot...

Stock DNA

stock-summary
Industry

Power

stock-summary
Market cap

INR 2,516 Cr (Small Cap)

stock-summary
P/E

1.00

stock-summary
Industry P/E

22

stock-summary
Dividend Yield

0.00%

stock-summary
Debt Equity

0.14

stock-summary
Return on Equity

10.44%

stock-summary
Price to Book

0.14

Revenue and Profits:
Net Sales:
6,344 Cr
(Quarterly Results - Jun 2026)
Net Profit:
372 Cr
stock-summaryTotal Returns
Total Returns (Price + Dividend) stock-summary
Dividend Yield (0%)
TimePeriod
Price Return
Dividend Return
Total Return
3 Months
0%
0%
0.0%
6 Months
-31.92%
0%
-31.92%
1 Year
-76.97%
0%
-76.97%
2 Years
-70.37%
0%
-70.37%
3 Years
-65.15%
0%
-65.15%
4 Years
-60.86%
0%
-60.86%
5 Years
-6.41%
0%
-6.41%

Latest dividend: 9.500000000000002 per share ex-dividend date: Sep-12-2018

Risk Adjusted Returns v/s stock-summary
Returns Beta
Icon
Beta has not been calculated since enough price history is not available
stock-summaryNews & Corporate Actions

Announcements stock-summary

Newspaper Publication - Special Window For Transfer And Dematerialisation Of Physical Shares

22-Aug-2026 | Source : BSE

Newspaper Publication - Special Window for transfer and dematerialisation of physical shares

Disclosure Under Regulation 30 Of The Securities And Exchange Board Of India (Listing Obligations And Disclosure Requirements) Regulations 2015

17-Aug-2026 | Source : BSE

Disclosure under Regulation 30 of the Securities and Exchange Board of India (Listing Obligations and Disclosure Requirements) Regulationns2015

Shareholder Meeting / Postal Ballot-Outcome of AGM

14-Aug-2026 | Source : BSE

Disclosure of events or information- 97th Annual General Meeting held on Friday August 14 2026

Corporate Actions stock-summary

stock-summary
BOARD MEETING

No Upcoming Board Meetings

stock-summary
DIVIDEND

Reliance Infrastructure Ltd has declared 95% dividend, ex-date: 12 Sep 18

stock-summary
SPLITS

No Splits history available

stock-summary
BONUS

No Bonus history available

stock-summary
RIGHTS

No Rights history available

stock-summaryKey Factors

Quality key factors stock-summary

Factor
Value
Sales Growth (5y)
3.58%
EBIT Growth (5y)
2.02%
EBIT to Interest (avg)
0.25
Debt to EBITDA (avg)
7.19
Net Debt to Equity (avg)
0.14
Sales to Capital Employed (avg)
0.97
Tax Ratio
Tax Ratio is Negative%
Dividend Payout Ratio
0
Pledged Shares
0
Institutional Holding
5.72%
ROCE (avg)
3.38%
ROE (avg)
7.41%

Valuation key factors

Factor
Value
P/E Ratio
1
Industry P/E
22
Price to Book Value
0.14
EV to EBIT
-6.20
EV to EBITDA
8.35
EV to Capital Employed
0.25
EV to Sales
0.24
PEG Ratio
NA
Dividend Yield
NA
ROCE (Latest)
-2.26%
ROE (Latest)
10.44%

Technicals key factors

Indicator
Weekly
Monthly
MACD
Mildly Bullish
Bearish
RSI
Bearish
Bullish
Bollinger Bands
Bearish
Mildly Bearish
Moving Averages
Bearish (Daily)
KST
Mildly Bullish
Bearish
Dow Theory
Mildly Bearish
Mildly Bearish
OBV
Mildly Bearish
Mildly Bearish
stock-summary Technical Indicator Scale: Bearish, Mildly Bearish, Sideways, Mildly Bullish, Bullish  Turned 
stock-summaryShareholding
Shareholding Snapshot : Jun 2026stock-summary
Shareholding Compare (%holding) stock-summary
Majority shareholders

Non Institution

Pledged Promoter Holdings

None

Mutual Funds

Held by 32 Schemes (0.1%)

FIIs

Held by 128 FIIs (4.95%)

Promoter with highest holding

Risee Infinity Private Limited (18.87%)

Highest Public shareholder

Authum Investment & Infrastructure Limited (0%)

Individual Investors Holdings

49.08%

stock-summaryFinancial
[
  {
    "link": "quarterly",
    "btn_text": "All Quarterly Results",
    "header": "Quarterly Results Snapshot (Consolidated) - Jun'26 - QoQ",
    "rhs": [
      {
        "prefix": "Net Sales ",
        "suffix": "QoQ Growth in quarter ended Jun 2026 is 58.56% vs -6.87% in Mar 2026",
        "dir": 1
      },
      {
        "prefix": "Consolidated Net Profit ",
        "suffix": "QoQ Growth in quarter ended Jun 2026 is -59.50% vs 8,156.03% in Mar 2026",
        "dir": -1
      }
    ],
    "table": {
      "header": [
        "Jun'26",
        "Mar'26",
        "Change(%)"
      ],
      "body": [
        {
          "field": "Net Sales",
          "val1": "6,344.27",
          "val2": "4,001.28",
          "chgp": "58.56%",
          "chgp_class": "positive"
        },
        {
          "field": "Operating Profit (PBDIT) excl Other Income",
          "val1": "-153.44",
          "val2": "-720.98",
          "chgp": "78.72%",
          "chgp_class": "positive"
        },
        {
          "field": "Interest",
          "val1": "413.24",
          "val2": "347.90",
          "chgp": "18.78%",
          "chgp_class": "negative"
        },
        {
          "field": "Exceptional Items",
          "val1": "140.56",
          "val2": "-496.10",
          "chgp": "128.33%",
          "chgp_class": "positive"
        },
        {
          "field": "Consolidate Net Profit",
          "val1": "371.78",
          "val2": "918.07",
          "chgp": "-59.50%",
          "chgp_class": "negative"
        },
        {
          "field": "Operating Profit Margin (Excl OI)",
          "val1": "-2.42%",
          "val2": "-18.02%",
          "chgp": "15.60%",
          "chgp_class": "positive"
        }
      ]
    }
  },
  {
    "link": "half-yearly",
    "btn_text": "All Half Yearly Results",
    "header": "Half Yearly Results Snapshot (Consolidated) - Sep'25",
    "rhs": [
      {
        "prefix": "Net Sales ",
        "suffix": " Growth in half year ended Sep 2025 is -15.97% vs 13.41% in Sep 2024",
        "dir": -1
      },
      {
        "prefix": "Consolidated Net Profit ",
        "suffix": " Growth in half year ended Sep 2025 is -48.79% vs 498.05% in Sep 2024",
        "dir": -1
      }
    ],
    "table": {
      "header": [
        "Sep'25",
        "Sep'24",
        "Change(%)"
      ],
      "body": [
        {
          "field": "Net Sales",
          "val1": "12,142.73",
          "val2": "14,451.32",
          "chgp": "-15.97%",
          "chgp_class": "negative"
        },
        {
          "field": "Operating Profit (PBDIT) excl Other Income",
          "val1": "1,295.07",
          "val2": "2,846.71",
          "chgp": "-54.51%",
          "chgp_class": "negative"
        },
        {
          "field": "Interest",
          "val1": "870.80",
          "val2": "942.18",
          "chgp": "-7.58%",
          "chgp_class": "positive"
        },
        {
          "field": "Exceptional Items",
          "val1": "1,509.58",
          "val2": "3,656.24",
          "chgp": "-58.71%",
          "chgp_class": "negative"
        },
        {
          "field": "Consolidate Net Profit",
          "val1": "1,971.04",
          "val2": "3,848.79",
          "chgp": "-48.79%",
          "chgp_class": "negative"
        },
        {
          "field": "Operating Profit Margin (Excl OI)",
          "val1": "10.67%",
          "val2": "19.70%",
          "chgp": "-9.03%",
          "chgp_class": "negative"
        }
      ]
    }
  },
  {
    "link": "nine-monthly",
    "btn_text": "All Nine Monthly Results",
    "header": "Nine Monthly Results Snapshot (Consolidated) - Dec'25",
    "rhs": [
      {
        "prefix": "Net Sales ",
        "suffix": "YoY Growth in nine months ended Dec 2025 is -15.63% vs 12.10% in Dec 2024",
        "dir": -1
      },
      {
        "prefix": "Consolidated Net Profit ",
        "suffix": "YoY Growth in nine months ended Dec 2025 is 260.10% vs 139.65% in Dec 2024",
        "dir": 1
      }
    ],
    "table": {
      "header": [
        "Dec'25",
        "Dec'24",
        "Change(%)"
      ],
      "body": [
        {
          "field": "Net Sales",
          "val1": "16,439.25",
          "val2": "19,483.87",
          "chgp": "-15.63%",
          "chgp_class": "negative"
        },
        {
          "field": "Operating Profit (PBDIT) excl Other Income",
          "val1": "1,724.54",
          "val2": "3,742.16",
          "chgp": "-53.92%",
          "chgp_class": "negative"
        },
        {
          "field": "Interest",
          "val1": "1,312.54",
          "val2": "1,409.72",
          "chgp": "-6.89%",
          "chgp_class": "positive"
        },
        {
          "field": "Exceptional Items",
          "val1": "1,529.58",
          "val2": "585.37",
          "chgp": "161.30%",
          "chgp_class": "positive"
        },
        {
          "field": "Consolidate Net Profit",
          "val1": "1,982.16",
          "val2": "550.44",
          "chgp": "260.10%",
          "chgp_class": "positive"
        },
        {
          "field": "Operating Profit Margin (Excl OI)",
          "val1": "10.49%",
          "val2": "19.21%",
          "chgp": "-8.72%",
          "chgp_class": "negative"
        }
      ]
    }
  },
  {
    "link": "annual",
    "btn_text": "All Annual Results",
    "header": "Annual Results Snapshot (Consolidated) - Mar'26",
    "rhs": [
      {
        "prefix": "Net Sales ",
        "suffix": "YoY Growth in year ended Mar 2026 is -13.36% vs 6.91% in Mar 2025",
        "dir": -1
      },
      {
        "prefix": "Consolidated Net Profit ",
        "suffix": "YoY Growth in year ended Mar 2026 is -41.26% vs 406.93% in Mar 2025",
        "dir": -1
      }
    ],
    "table": {
      "header": [
        "Mar'26",
        "Mar'25",
        "Change(%)"
      ],
      "body": [
        {
          "field": "Net Sales",
          "val1": "20,440.53",
          "val2": "23,591.88",
          "chgp": "-13.36%",
          "chgp_class": "negative"
        },
        {
          "field": "Operating Profit (PBDIT) excl Other Income",
          "val1": "1,003.56",
          "val2": "3,756.45",
          "chgp": "-73.28%",
          "chgp_class": "negative"
        },
        {
          "field": "Interest",
          "val1": "1,660.44",
          "val2": "1,784.22",
          "chgp": "-6.94%",
          "chgp_class": "positive"
        },
        {
          "field": "Exceptional Items",
          "val1": "1,033.47",
          "val2": "1,099.72",
          "chgp": "-6.02%",
          "chgp_class": "negative"
        },
        {
          "field": "Consolidate Net Profit",
          "val1": "2,900.23",
          "val2": "4,937.52",
          "chgp": "-41.26%",
          "chgp_class": "negative"
        },
        {
          "field": "Operating Profit Margin (Excl OI)",
          "val1": "4.91%",
          "val2": "15.92%",
          "chgp": "-11.01%",
          "chgp_class": "negative"
        }
      ]
    }
  }
]

Quarterly Results Snapshot (Consolidated) - Jun'26 - QoQstock-summary

Jun'26
Mar'26
Change(%)
Net Sales
6,344.27
4,001.28
58.56%
Operating Profit (PBDIT) excl Other Income
-153.44
-720.98
78.72%
Interest
413.24
347.90
18.78%
Exceptional Items
140.56
-496.10
128.33%
Consolidate Net Profit
371.78
918.07
-59.50%
Operating Profit Margin (Excl OI)
-2.42%
-18.02%
15.60%
Values in Rs Cr.
Direction Arrows
Net Sales

QoQ Growth in quarter ended Jun 2026 is 58.56% vs -6.87% in Mar 2026

Direction Arrows
Consolidated Net Profit

QoQ Growth in quarter ended Jun 2026 is -59.50% vs 8,156.03% in Mar 2026

Half Yearly Results Snapshot (Consolidated) - Sep'25stock-summary

Sep'25
Sep'24
Change(%)
Net Sales
12,142.73
14,451.32
-15.97%
Operating Profit (PBDIT) excl Other Income
1,295.07
2,846.71
-54.51%
Interest
870.80
942.18
-7.58%
Exceptional Items
1,509.58
3,656.24
-58.71%
Consolidate Net Profit
1,971.04
3,848.79
-48.79%
Operating Profit Margin (Excl OI)
10.67%
19.70%
-9.03%
Values in Rs Cr.
Direction Arrows
Net Sales

Growth in half year ended Sep 2025 is -15.97% vs 13.41% in Sep 2024

Direction Arrows
Consolidated Net Profit

Growth in half year ended Sep 2025 is -48.79% vs 498.05% in Sep 2024

Nine Monthly Results Snapshot (Consolidated) - Dec'25stock-summary

Dec'25
Dec'24
Change(%)
Net Sales
16,439.25
19,483.87
-15.63%
Operating Profit (PBDIT) excl Other Income
1,724.54
3,742.16
-53.92%
Interest
1,312.54
1,409.72
-6.89%
Exceptional Items
1,529.58
585.37
161.30%
Consolidate Net Profit
1,982.16
550.44
260.10%
Operating Profit Margin (Excl OI)
10.49%
19.21%
-8.72%
Values in Rs Cr.
Direction Arrows
Net Sales

YoY Growth in nine months ended Dec 2025 is -15.63% vs 12.10% in Dec 2024

Direction Arrows
Consolidated Net Profit

YoY Growth in nine months ended Dec 2025 is 260.10% vs 139.65% in Dec 2024

Annual Results Snapshot (Consolidated) - Mar'26stock-summary

Mar'26
Mar'25
Change(%)
Net Sales
20,440.53
23,591.88
-13.36%
Operating Profit (PBDIT) excl Other Income
1,003.56
3,756.45
-73.28%
Interest
1,660.44
1,784.22
-6.94%
Exceptional Items
1,033.47
1,099.72
-6.02%
Consolidate Net Profit
2,900.23
4,937.52
-41.26%
Operating Profit Margin (Excl OI)
4.91%
15.92%
-11.01%
Values in Rs Cr.
Direction Arrows
Net Sales

YoY Growth in year ended Mar 2026 is -13.36% vs 6.91% in Mar 2025

Direction Arrows
Consolidated Net Profit

YoY Growth in year ended Mar 2026 is -41.26% vs 406.93% in Mar 2025

stock-summaryCompany CV
About Reliance Infrastructure Ltd stock-summary
stock-summary
Reliance Infrastructure Ltd
Small Cap
Power
Reliance Infrastructure Limited was incorporated in October, 1929 with the name 'Bombay Suburban Electric Supply Limited (BSES)' and then changed to BSES Limited. The name of the Company was changed to Reliance Energy Limited with effect from February 24, 2004 and later on, was changed to 'Reliance Infrastructure Limited' on April 28, 2008.
Company Coordinates stock-summary
Company Details
Reliance Centre Ground Floor, 19 Walchand Hirachand Marg Mumbai Maharashtra : 400001
stock-summary
Tel: 91-022-43031000
stock-summary
rinfra.investor@relianceada.com
Registrar Details
Karvy Computershare Pvt Ltd., Karvy Selenium, Tower-B Plot No 31 & 32, Survey No 116/22, 115/24, 115/25, Financial District, Nanakramguda, Serilingampally, Mandal Ranga Reddy Dist, Hyderabad