
Compare Guj. Containers with Similar Stocks
Total Returns (Price + Dividend) 
Latest dividend: 1.5 per share ex-dividend date: Aug-08-2025
Risk Adjusted Returns v/s
Returns Beta

News

Gujarat Containers Ltd Downgraded to Strong Sell Amid Deteriorating Technicals and Flat Financials
Gujarat Containers Ltd, a micro-cap player in the packaging sector, has seen its investment rating downgraded from Sell to Strong Sell as of 15 Jul 2026. This revision reflects deteriorating technical indicators, flat recent financial performance, and underwhelming long-term returns, despite an attractive valuation metric. Investors should carefully consider these factors amid ongoing market volatility.
Read full news article
Gujarat Containers Ltd Upgraded to Sell on Technical Improvements Despite Flat Financials
Gujarat Containers Ltd has seen its investment rating upgraded from Strong Sell to Sell, driven primarily by improvements in its technical indicators despite continued flat financial performance and weak long-term fundamentals. The packaging sector company’s recent technical trend shift has prompted a reassessment of its outlook, although valuation and financial trends remain subdued.
Read full news article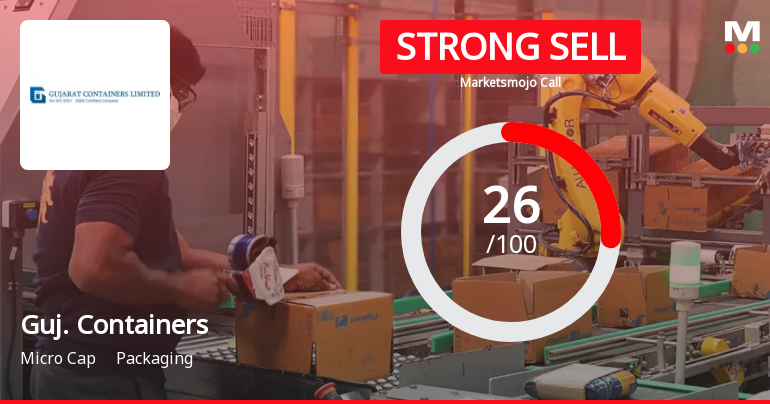
Gujarat Containers Ltd is Rated Strong Sell
Gujarat Containers Ltd is rated Strong Sell by MarketsMOJO, with this rating last updated on 24 June 2026. However, the analysis and financial metrics discussed here reflect the stock's current position as of 07 July 2026, providing investors with the latest insights into its performance and outlook.
Read full news article Announcements
Announcement Of Revised Record Date
16-Jul-2026 | Source : BSEThe record date is revised from 07/08/2026 to 12/08/2026
Board Meeting Outcome for Outcome Of Adjourned Board Meeting (Originally Held On 02Nd May 2026) Held On 16Th July 2026
16-Jul-2026 | Source : BSEOutcome of Adjourned Board Meeting (originally held on 02nd May 2026) held on 16th July 2026
Board Meeting Outcome for Outcome Of Adjourned Board Meeting (Originally Held On 02Nd May 2026) Held On 16Th July 2026
16-Jul-2026 | Source : BSEOutcome of Adjourned Board Meeting (originally held on 02nd May 2026) held on 16th July 2026
Corporate Actions

No Upcoming Board Meetings

Gujarat Containers Ltd has declared 15% dividend, ex-date: 07 Aug 26

No Splits history available

No Bonus history available

No Rights history available
Quality key factors
Valuation key factors
Technicals key factors
 Technical Indicator Scale: Bearish, Mildly Bearish, Sideways, Mildly Bullish, Bullish Turned
 Shareholding Snapshot : Jun 2026
Shareholding Compare (%holding)
Promoters
None
Held by 0 Schemes
Held by 0 FIIs
Kiran Arvindlal Shah (31.7%)
Keshav Garg (2.19%)
39.23%
Quarterly Results Snapshot (Standalone) - Mar'26 - QoQ

QoQ Growth in quarter ended Mar 2026 is -0.32% vs 0.98% in Dec 2025
QoQ Growth in quarter ended Mar 2026 is 16.42% vs 47.79% in Dec 2025
Half Yearly Results Snapshot (Standalone) - Sep'25
Growth in half year ended Sep 2025 is -8.81% vs 16.86% in Sep 2024
Growth in half year ended Sep 2025 is -31.52% vs -8.88% in Sep 2024
Nine Monthly Results Snapshot (Standalone) - Dec'25
YoY Growth in nine months ended Dec 2025 is -5.60% vs 9.68% in Dec 2024
YoY Growth in nine months ended Dec 2025 is -23.90% vs -5.71% in Dec 2024
Annual Results Snapshot (Standalone) - Mar'26
YoY Growth in year ended Mar 2026 is -3.94% vs 7.40% in Mar 2025
YoY Growth in year ended Mar 2026 is -10.88% vs -8.31% in Mar 2025
About Gujarat Containers Ltd

Company Coordinates


