
Compare Gujarat Cotex with Similar Stocks
Dashboard
With a Operating Losses, the company has a Weak Long Term Fundamental Strength
- Low ability to service debt as the company has a high Debt to EBITDA ratio of 0.42 times
- The company has been able to generate a Return on Equity (avg) of 3.13% signifying low profitability per unit of shareholders funds
Flat results in Mar 26
Risky - Negative Operating Profits
Underperformed the market in the last 1 year
Stock DNA
Garments & Apparels
INR 50 Cr (Micro Cap)
457.00
21
0.00%
0.03
1.64%
7.88
Total Returns (Price + Dividend) 
Gujarat Cotex for the last several years.
Risk Adjusted Returns v/s
Returns Beta

News
Are Gujarat Cotex Ltd latest results good or bad?
The latest financial results for Gujarat Cotex Ltd for the quarter ended March 2026 reveal a complex operational landscape characterized by contrasting trends in revenue and profitability. In this quarter, the company reported net sales of ₹8.58 crores, reflecting a sequential growth of 12.45% from ₹7.63 crores in the previous quarter and a year-on-year increase of 7.12% from ₹8.01 crores in the same quarter last year. This growth in revenue indicates a positive trend in top-line performance. However, the underlying profitability metrics tell a different story. The company experienced a net loss of ₹0.72 crores, which marks a significant decline compared to a profit of ₹0.05 crores in the previous quarter. This shift highlights a troubling deterioration in the company's ability to convert sales into profits. Moreover, the operating profit before depreciation, interest, tax, and other income (PBDIT) fell ...
Read full news article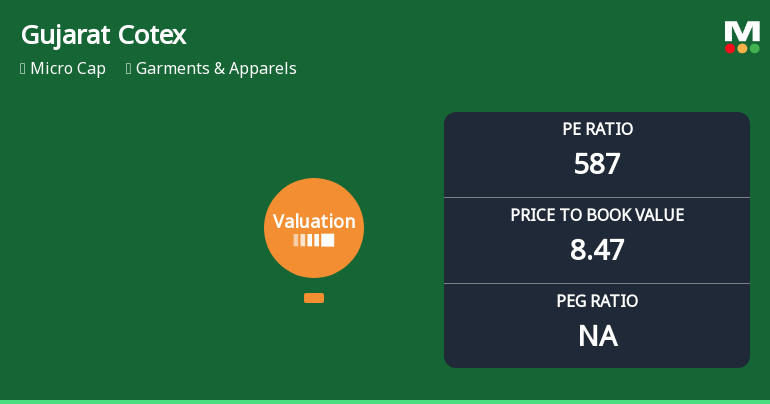
Gujarat Cotex Ltd Valuation Shifts Signal Elevated Risk Amid Price Correction
Gujarat Cotex Ltd, a micro-cap player in the Garments & Apparels sector, has seen a marked deterioration in its valuation metrics, shifting from a previously held 'very expensive' status to now being classified as 'risky'. This change accompanies a significant price correction and a downgrade in its Mojo Grade from Hold to Sell, reflecting growing concerns over its price attractiveness relative to peers and historical benchmarks.
Read full news article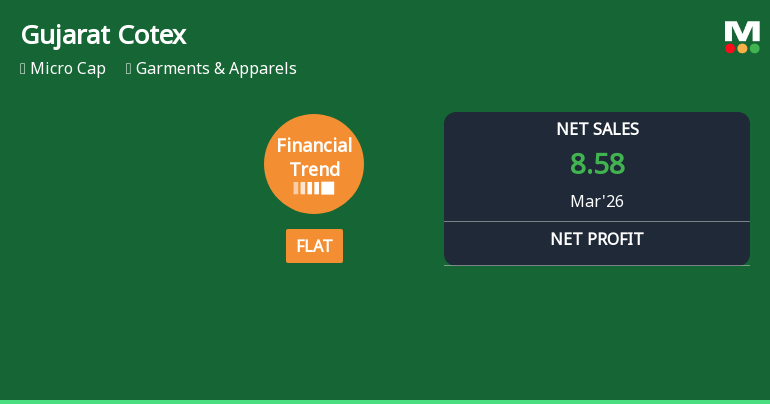
Gujarat Cotex Ltd Reports Flat Quarterly Performance Amid Margin Pressures
Gujarat Cotex Ltd, a micro-cap player in the Garments & Apparels sector, has witnessed a marked shift in its financial trend, moving from positive momentum to a flat performance in the quarter ended March 2026. Despite a healthy rise in net sales over the nine-month period, the company’s profitability metrics have deteriorated sharply, prompting a downgrade in its mojo grade to Sell from Hold as of 15 May 2026.
Read full news article Announcements
Announcement under Regulation 30 (LODR)-Newspaper Publication
03-Jun-2026 | Source : BSESubmission of Newspaper Advertisements for Publication of Audited financial Statements for Quarter and Year Ended 31/03/2026
Audited Financial Result For Quarter And Year Ended 31/03/2026
29-May-2026 | Source : BSESubmission of Financial Results for 31/03/2026.
Financial Results For 31St March 2026
29-May-2026 | Source : BSESubmission of Financial Results for 31st March 2026
Corporate Actions

No Upcoming Board Meetings

No Dividend history available

Gujarat Cotex Ltd has announced 5:10 stock split, ex-date: 22 Nov 19

No Bonus history available

Gujarat Cotex Ltd has announced 6:1 rights issue, ex-date: 30 Mar 26
Quality key factors
Valuation key factors
Technicals key factors
 Technical Indicator Scale: Bearish, Mildly Bearish, Sideways, Mildly Bullish, Bullish Turned
 Shareholding Snapshot : May 2026
Shareholding Compare (%holding)
Non Institution
None
Held by 0 Schemes
Held by 0 FIIs
Priyavanda Sudhir Parekh (1.61%)
Setu Securities Private Limited . (5.27%)
64.35%
Quarterly Results Snapshot (Standalone) - Mar'26 - QoQ

QoQ Growth in quarter ended Mar 2026 is 12.45% vs -56.05% in Dec 2025

QoQ Growth in quarter ended Mar 2026 is -1,540.00% vs -86.49% in Dec 2025
Half Yearly Results Snapshot (Standalone) - Sep'25
Growth in half year ended Sep 2025 is 80.37% vs 39.32% in Sep 2024
Growth in half year ended Sep 2025 is 126.47% vs 750.00% in Sep 2024
Nine Monthly Results Snapshot (Standalone) - Dec'25
YoY Growth in nine months ended Dec 2025 is 54.77% vs 45.77% in Dec 2024
YoY Growth in nine months ended Dec 2025 is 78.26% vs 253.85% in Dec 2024
Annual Results Snapshot (Standalone) - Mar'26
YoY Growth in year ended Mar 2026 is 40.75% vs 61.50% in Mar 2025
YoY Growth in year ended Mar 2026 is -54.55% vs 15.79% in Mar 2025
About Gujarat Cotex Ltd

Company Coordinates


