
Compare Gujarat Fluoroch with Similar Stocks
Stock DNA
Specialty Chemicals
INR 43,012 Cr (Mid Cap)
73.00
43
0.08%
0.22
7.52%
5.47
Total Returns (Price + Dividend) 
Latest dividend: 2.996026234567901 per share ex-dividend date: Sep-22-2025
Risk Adjusted Returns v/s
Returns Beta

News
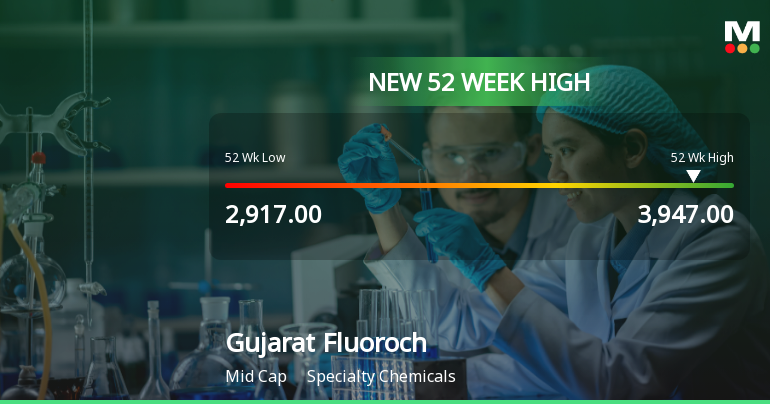
Broad-Based Technical Strength Lifts Gujarat Fluorochemicals Ltd to 52-Week High of Rs 3947
With a decisive surge to Rs 3947 on 24 Jun 2026, Gujarat Fluorochemicals Ltd has reached a fresh 52-week high, marking a notable milestone in its price momentum. This advance comes amid a backdrop of sustained technical strength across multiple indicators, underscoring the stock’s robust upward trajectory over the past year.
Read full news article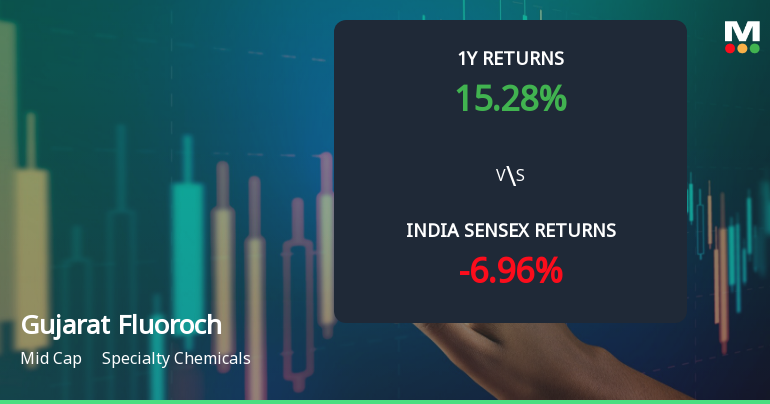
Gujarat Fluorochemicals Ltd Sees Bullish Momentum Amid Technical Upgrades
Gujarat Fluorochemicals Ltd, a mid-cap player in the specialty chemicals sector, has witnessed a notable shift in its technical momentum, moving from a mildly bullish stance to a more confident bullish trend. Despite a recent downgrade in its Mojo Grade from Hold to Sell, the stock’s price action and technical indicators suggest a complex but potentially promising outlook for investors.
Read full news article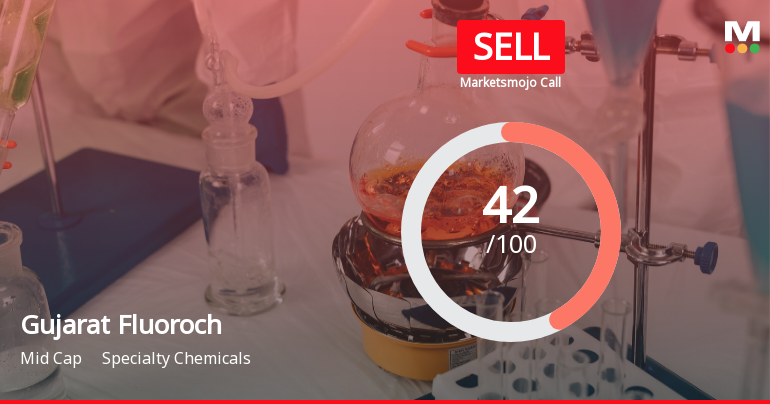
Gujarat Fluorochemicals Ltd Downgraded to Sell Amid Mixed Financial and Technical Signals
Gujarat Fluorochemicals Ltd, a prominent player in the specialty chemicals sector, has seen its investment rating downgraded from Hold to Sell as of 22 June 2026. This decision follows a comprehensive reassessment across four critical parameters: quality, valuation, financial trend, and technical indicators. Despite some market-beating returns, the company’s recent financial performance and evolving technical signals have raised concerns among analysts, prompting a cautious stance on the stock.
Read full news article Announcements
Announcement under Regulation 30 (LODR)-Acquisition
03-Jun-2026 | Source : BSEIntimation for incorporation of a Step-down Subsidiary Company.
Announcement under Regulation 30 (LODR)-Earnings Call Transcript
01-Jun-2026 | Source : BSETranscript of conference call with Analysts/Institutional Investors held on 26th May 2026
Intimation Of Resignation Of Statutory Auditor Of GFCL EV Products Limited Material Subsidiary Of The Company
29-May-2026 | Source : BSEIntimation of resignation of Statutory Auditor of GFCL EV Products Limited Material Subsidiary of the Company
Corporate Actions

No Upcoming Board Meetings

Gujarat Fluorochemicals Ltd has declared 300% dividend, ex-date: 22 Sep 25

No Splits history available

No Bonus history available

No Rights history available
Quality key factors
Valuation key factors
Technicals key factors
 Technical Indicator Scale: Bearish, Mildly Bearish, Sideways, Mildly Bullish, Bullish Turned
 Shareholding Snapshot : Mar 2026
Shareholding Compare (%holding)
Promoters
3.0778
Held by 23 Schemes (9.27%)
Held by 173 FIIs (4.28%)
Inox Leasing And Finance Limited (52.61%)
Akash Bhanshali (4.75%)
14.0%
Quarterly Results Snapshot (Consolidated) - Mar'26 - QoQ

QoQ Growth in quarter ended Mar 2026 is 20.51% vs -6.12% in Dec 2025
QoQ Growth in quarter ended Mar 2026 is 6.86% vs -43.02% in Dec 2025
Half Yearly Results Snapshot (Consolidated) - Sep'25

Growth in half year ended Sep 2025 is 5.37% vs 9.65% in Sep 2024
Growth in half year ended Sep 2025 is 58.52% vs -9.84% in Sep 2024
Nine Monthly Results Snapshot (Consolidated) - Dec'25
YoY Growth in nine months ended Dec 2025 is 3.27% vs 11.56% in Dec 2024
YoY Growth in nine months ended Dec 2025 is 30.99% vs 6.29% in Dec 2024
Annual Results Snapshot (Consolidated) - Mar'26
YoY Growth in year ended Mar 2026 is 5.47% vs 10.65% in Mar 2025
YoY Growth in year ended Mar 2026 is 5.13% vs 25.52% in Mar 2025
About Gujarat Fluorochemicals Ltd

Company Coordinates


