
Compare Pidilite Inds. with Similar Stocks
Dashboard
Strong Long Term Fundamental Strength with an average Return on Equity (ROE) of 20.37%
- Healthy long term growth as Operating profit has grown by an annual rate 16.12%
- The company is Net-Debt Free
High Institutional Holdings at 21.58%
Company is among the highest 1% of companies rated by MarketsMojo across all 4,000 stocks
Market Beating Performance
Stock DNA
Specialty Chemicals
INR 165,869 Cr (Large Cap)
67.00
47
1.01%
-0.35
22.70%
15.32
Total Returns (Price + Dividend) 
Latest dividend: 11.5 per share ex-dividend date: Jul-23-2026
Risk Adjusted Returns v/s
Returns Beta

News
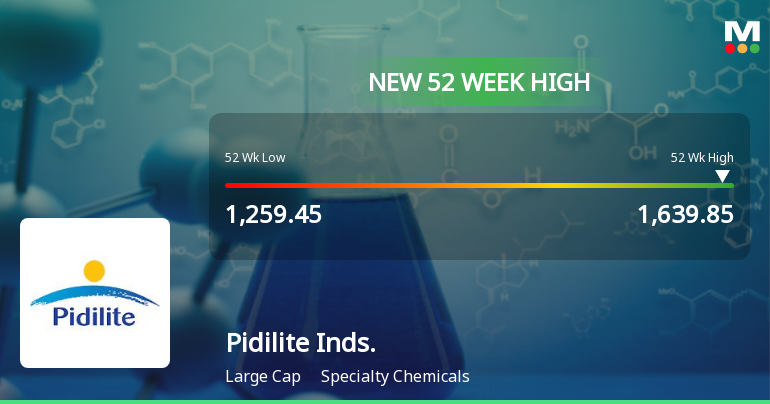
Broad-Based Technical Strength Lifts Pidilite Industries Ltd to 52-Week High of Rs 1639.85
With a steady climb over the past five sessions, Pidilite Industries Ltd has surged to a fresh 52-week high of Rs 1639.85 on 30 Jul 2026, marking a significant milestone in its price momentum. This advance comes amid a backdrop of broad technical alignment and sustained buying interest, underscoring the stock’s robust upward trajectory despite a slightly subdued broader market.
Read full news article
Broad-Based Technical Strength Lifts Pidilite Industries Ltd to 52-Week High of Rs 1636.75
With a decisive break above Rs 1636.75 on 29 Jul 2026, Pidilite Industries Ltd has reached a fresh 52-week high, marking a significant milestone in its price momentum. This advance comes amid a sustained four-day rally that has lifted the stock by 4.18%, despite a slight underperformance relative to its sector today.
Read full news article
Pidilite Industries Ltd is Rated Buy
Pidilite Industries Ltd is rated 'Buy' by MarketsMOJO, with this rating last updated on 25 June 2026. However, the analysis and financial metrics discussed here reflect the stock's current position as of 29 July 2026, providing investors with the most up-to-date insights into the company’s performance and outlook.
Read full news article Announcements
Disclosure Under Regulation 30 Of SEBI (Listing Obligations And Disclosure Requirements) Regulations 2015
22-Jul-2026 | Source : BSEDisclosure under Regulation 30
Intimation Under Regulation 30 Of The SEBI (Listing Obligations And Disclosure Requirements) Regulations 2015.
21-Jul-2026 | Source : BSEIntimation under Regulation 30
Announcement under Regulation 30 (LODR)-Newspaper Publication
16-Jul-2026 | Source : BSENewspaper publication regarding Special window for transfer and dematerialisation of physical securities
Corporate Actions

04 Aug 2026

Pidilite Industries Ltd has declared 1150% dividend, ex-date: 23 Jul 26

No Splits history available

Pidilite Industries Ltd has announced 1:1 bonus issue, ex-date: 23 Sep 25

No Rights history available
Quality key factors
Valuation key factors
Technicals key factors
 Technical Indicator Scale: Bearish, Mildly Bearish, Sideways, Mildly Bullish, Bullish Turned
 Shareholding Snapshot : Jun 2026
Shareholding Compare (%holding)
Promoters
None
Held by 38 Schemes (4.33%)
Held by 775 FIIs (11.69%)
Madhukar Balvantray Parekh Partner Representing Triveni Corporations (9.42%)
Life Insurance Corporation Of India (3.85%)
7.68%
Quarterly Results Snapshot (Consolidated) - Mar'26 - YoY

YoY Growth in quarter ended Mar 2026 is 14.08% vs 8.25% in Mar 2025

YoY Growth in quarter ended Mar 2026 is 37.16% vs 40.50% in Mar 2025
Half Yearly Results Snapshot (Consolidated) - Sep'25
Growth in half year ended Sep 2025 is 10.21% vs 4.39% in Sep 2024
Growth in half year ended Sep 2025 is 13.63% vs 19.95% in Sep 2024
Nine Monthly Results Snapshot (Consolidated) - Dec'25
YoY Growth in nine months ended Dec 2025 is 10.18% vs 5.46% in Dec 2024
YoY Growth in nine months ended Dec 2025 is 13.04% vs 15.76% in Dec 2024
Annual Results Snapshot (Consolidated) - Mar'26
YoY Growth in year ended Mar 2026 is 11.11% vs 6.12% in Mar 2025
YoY Growth in year ended Mar 2026 is 17.95% vs 20.06% in Mar 2025
About Pidilite Industries Ltd

Company Coordinates


