
Compare Guj. Raffia Inds with Similar Stocks
Dashboard
Weak Long Term Fundamental Strength with a -1.47% CAGR growth in Operating Profits over the last 5 years
- Company's ability to service its debt is weak with a poor EBIT to Interest (avg) ratio of 0.50
- The company has been able to generate a Return on Equity (avg) of 4.17% signifying low profitability per unit of shareholders funds
With ROE of 4.7, it has a Expensive valuation with a 1 Price to Book Value
Total Returns (Price + Dividend) 
Guj. Raffia Inds for the last several years.
Risk Adjusted Returns v/s
Returns Beta

News

Gujarat Raffia Industries Ltd Locks at Upper Circuit With 4.86% Gain — Buyers Queue, Sellers Absent
At Rs 42.75, the buying was done — not because demand dried up, but because the exchange wouldn't let the stock go any higher. Gujarat Raffia Industries Ltd locked at its upper circuit of 4.86% on 19 Jun 2026, with buyers queuing and no sellers willing to part with shares.
Read full news article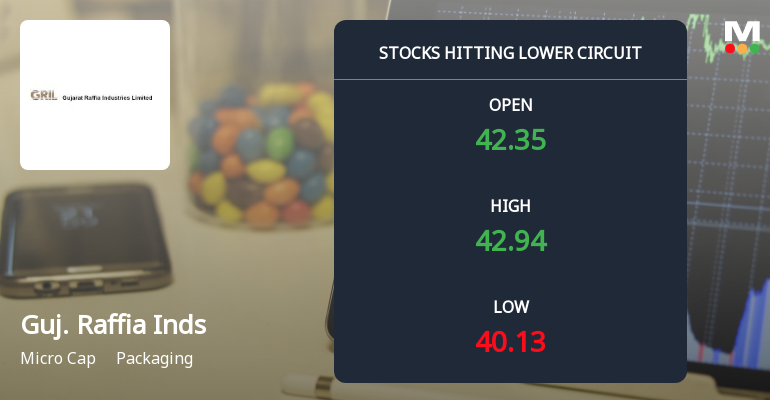
Gujarat Raffia Industries Ltd Locks at Lower Circuit With 4.17% Loss — Sellers Queue, No Buyers in Sight
At Rs 39.68, sellers were still queuing — but there were no buyers willing to take the other side. Gujarat Raffia Industries Ltd locked at its lower circuit of 5% on 11 Jun 2026, with unfilled sell orders and a frozen price, signalling a day dominated by supply overwhelming demand.
Read full news article
Gujarat Raffia Industries Downgraded to Strong Sell Amid Mixed Financial and Technical Signals
Gujarat Raffia Industries Ltd has been downgraded from a Sell to a Strong Sell rating as of 1 June 2026, reflecting a deterioration in its technical outlook and valuation metrics despite recent positive quarterly financial results. The downgrade is primarily driven by a shift in technical indicators, weak long-term financial trends, and an expensive valuation relative to peers, signalling caution for investors in this packaging sector micro-cap.
Read full news article Announcements
Board Meeting Outcome for Outcome Of Board Meeting
21-May-2026 | Source : BSEOutcome of Board Meeting
Financial Result For Financial Year Ended And Quarter Ended 31.03.2026
21-May-2026 | Source : BSEOutcome of Board Meeting
Board Meeting Intimation for Intimation Of Board Meeting Will Be Held On 21.05.2026
16-May-2026 | Source : BSEGujarat Raffia Industries Ltdhas informed BSE that the meeting of the Board of Directors of the Company is scheduled on 21/05/2026 inter alia to consider and approve Intimation of Board Meeting will be held on 21.05.2026
Corporate Actions

No Upcoming Board Meetings

No Dividend history available

Gujarat Raffia Industries Ltd has announced 10:5 stock split, ex-date: 20 Dec 07

No Bonus history available

No Rights history available
Quality key factors
Valuation key factors
Technicals key factors
 Technical Indicator Scale: Bearish, Mildly Bearish, Sideways, Mildly Bullish, Bullish Turned
 Shareholding Snapshot : Mar 2026
Shareholding Compare (%holding)
Non Institution
None
Held by 0 Schemes
Held by 0 FIIs
Pradeep Bhutoria (12.62%)
None
58.56%
Quarterly Results Snapshot (Standalone) - Mar'26 - QoQ

QoQ Growth in quarter ended Mar 2026 is 12.93% vs -8.46% in Dec 2025
QoQ Growth in quarter ended Mar 2026 is 272.73% vs -42.11% in Dec 2025
Half Yearly Results Snapshot (Standalone) - Sep'25
Growth in half year ended Sep 2025 is 135.58% vs -4.02% in Sep 2024

Growth in half year ended Sep 2025 is 51.43% vs 66.67% in Sep 2024
Nine Monthly Results Snapshot (Standalone) - Dec'25
YoY Growth in nine months ended Dec 2025 is 178.72% vs -7.22% in Dec 2024
YoY Growth in nine months ended Dec 2025 is 48.84% vs 10.26% in Dec 2024
Annual Results Snapshot (Standalone) - Mar'26
YoY Growth in year ended Mar 2026 is 194.81% vs -2.81% in Mar 2025
YoY Growth in year ended Mar 2026 is 101.92% vs -3.70% in Mar 2025
About Gujarat Raffia Industries Ltd

Company Coordinates


