Haldyn Glass

  • Market Cap: Micro Cap
  • Industry: Packaging
  • ISIN: INE506D01020
  • NSEID: HALDYNGL
  • BSEID: 515147
INR
140.10
0.81 (0.58%)
BSENSE

Aug 31, 10:33 AM

BSE+NSE Vol: 25.96 k

  • Price Points
  • Score
  • Mojo Parameters
  • Total Return
  • News and Corporate Actions
  • Key factors
  • Shareholding
  • Financials
  • CompanyCV
stock-summaryPrice Point
High/Low

1Day

52 Week

Valuation
Technical
Day's Volume

CASH

25.96 k (180.01%) Volume

Shareholding (Jun 2026)

FII

0.00%

Held by 1 FIIs

DII

2.03%

Held by 0 DIIs

Promoter

59.14%

Why is Haldyn Glass Ltd falling/rising?

31-Aug-2026

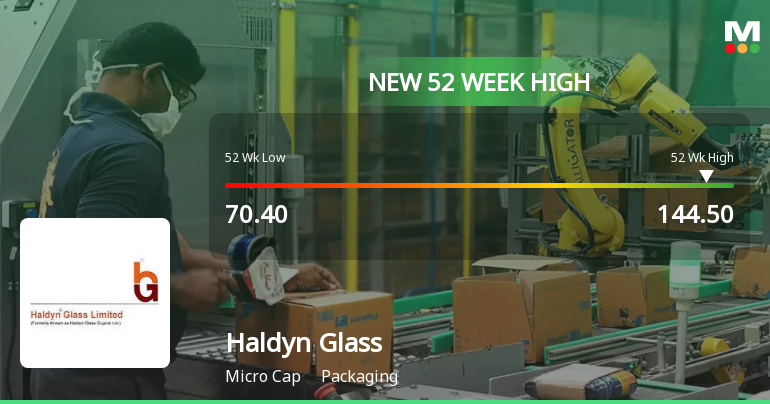
As of 30-Aug, Haldyn Glass Ltd's stock price is rising, currently at Rs. 138.85, with a year-to-date increase of 42.59% and a new 52-week high of Rs. 141.05. Despite a decline in investor participation, the stock shows strong performance and positive market sentiment.

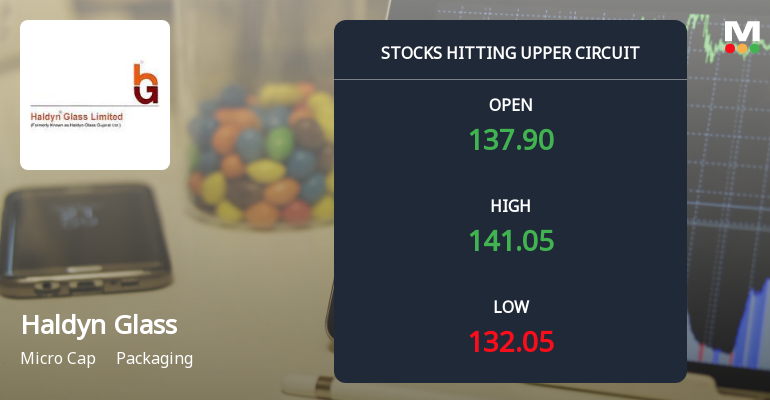
As of 30-Aug, Haldyn Glass Ltd's stock price is rising, currently at Rs. 138.85, reflecting an increase of Rs. 4.5 or 3.35%. The stock has shown strong performance over various periods, with a weekly increase of 4.99% and a monthly rise of 15.61%, significantly outperforming the Sensex, which has seen a decline of 0.36% over the same week. Year-to-date, the stock has surged by 42.59%, while the Sensex has dropped by 9.34%. <BR><BR>Today, the stock reached a new 52-week high of Rs. 141.05, indicating positive momentum. It has been gaining for three consecutive days, with a total return of 4.36% during this period. The stock opened with a gain of 2.64% today and touched an intraday high of Rs. 141.05, which is a 4.99% increase. Additionally, Haldyn Glass is trading above its 5-day, 20-day, 50-day, 100-day, and 200-day moving averages, further indicating a bullish trend.<BR><BR>However, it is worth noting that there has been a decline in investor participation, with delivery volume falling by 69.62% compared to the 5-day average. Despite this, the stock remains liquid enough for trading, suggesting that the recent price movements are driven by strong demand and positive market sentiment rather than high trading volume. Overall, the combination of consistent price increases, strong performance relative to the benchmark, and the achievement of new highs contributes to the rising stock price of Haldyn Glass Ltd.

View full answer

Who are in the management team of Haldyn Glass?

14-Aug-2026

The management team of Haldyn Glass includes N D Shetty (Executive Chairman), Tarun N Shetty (Managing Director), and several independent directors: K J Udeshi, Sikander Talwar, G Padbhanabhan, and Ajit Shah, along with Rohan Y Ajila (Director) and Dhruv Mehta (Company Secretary & Compliance Officer). They are responsible for the company's strategic direction and governance.

The management team of Haldyn Glass includes the following key members:<BR><BR>1. **N D Shetty** - Executive Chairman<BR>2. **Tarun N Shetty** - Managing Director<BR>3. **K J Udeshi** - Independent Director<BR>4. **Sikander Talwar** - Independent Director<BR>5. **Rohan Y Ajila** - Director<BR>6. **G Padbhanabhan** - Independent Director<BR>7. **Ajit Shah** - Independent Director<BR>8. **Dhruv Mehta** - Company Secretary & Compliance Officer<BR><BR>This team plays a crucial role in guiding the company's strategic direction and governance.

View full answer

What does Haldyn Glass do?

14-Aug-2026

Haldyn Glass Ltd is a micro-cap company in the glass container industry, reporting net sales of 139 Cr and a net profit of 10 Cr for June 2026. It has a market cap of INR 657 Cr and key financial metrics include a P/E of 22.00 and a dividend yield of 0.56%.

Overview: <BR>Haldyn Glass Ltd is a major player in the glass container industry, operating within the micro-cap market segment.<BR><BR>History: <BR>Haldyn Glass Ltd was initially incorporated as 'Haldyn Glass Gujarat Limited' in 1991 and changed its name to 'Haldyn Glass Limited' on December 12, 2011. The most recent quarterly results reported net sales and net profit for June 2026.<BR><BR>Financial Snapshot: <BR>Most recent Net Sales: 139 Cr (Quarterly Results - Jun 2026) <BR>Most recent Net Profit: 10 Cr (Quarterly Results - Jun 2026) <BR>Market-cap value: INR 657 Cr (Micro Cap)<BR><BR>Key Metrics: <BR>P/E: 22.00 <BR>Industry P/E: 34 <BR>Dividend Yield: 0.56% <BR>Debt Equity: 0.45 <BR>Return on Equity: 11.17% <BR>Price to Book: 2.86<BR><BR>Contact Details: <BR>Address: Gavasad Village, Padra Taluka Vadodara Gujarat : 391430 <BR>Tel: 91-2662 242339-42 <BR>Email: baroda@haldynglass.com <BR>Website: http://www.haldynglass.com

View full answer

Who are the peers of the Haldyn Glass?

14-Aug-2026

Haldyn Glass's peers include Huhtamaki India, Arrow Greentech, Commerl. Synbags, Ester Industries, Oricon Enterprises, Kanpur Plastipa, Nahar Poly, Pyramid Technoplast, and TPL Plastech. In terms of management risk, growth, and capital structure, Haldyn Glass is rated average, with a 1-year return of -3.93%.

Peers: Haldyn Glass's peers include Huhtamaki India, Arrow Greentech, Commerl. Synbags, Ester Industries, Oricon Enterpris, Kanpur Plastipa., Nahar Poly, Pyramid Technopl, and TPL Plastech.<BR><BR>Quality Snapshot: Excellent management risk is observed at Arrow Greentech, while Average management risk is found at Huhtamaki India, Commerl. Synbags, Oricon Enterpris, Kanpur Plastipa., Nahar Poly, Pyramid Technopl, TPL Plastech, and Haldyn Glass. Below Average management risk is noted at Ester Industries. Growth is Excellent at Arrow Greentech, while Below Average growth is seen at Huhtamaki India, Commerl. Synbags, Ester Industries, Oricon Enterpris, Kanpur Plastipa., Nahar Poly, Pyramid Technopl, TPL Plastech, and Haldyn Glass. The Capital Structure is Excellent at Pyramid Technopl and Good at Huhtamaki India, Haldyn Glass, Nahar Poly, and TPL Plastech, while Below Average Capital Structure is found at Commerl. Synbags, Ester Industries, Oricon Enterpris, and Kanpur Plastipa.<BR><BR>Return Snapshot: The peer with the highest 1-year return is Commerl. Synbags at 108.26%, while the lowest is Nahar Poly at -16.97%. Haldyn Glass's 1-year return is -3.93%, which is higher than Nahar Poly's but lower than Huhtamaki India's 30.72%. Additionally, Oricon Enterpris and Nahar Poly have negative six-month returns.

View full answer

How big is Haldyn Glass?

14-Aug-2026

As of 14th August, Haldyn Glass Ltd has a market capitalization of 680.50 Cr, with recent net sales of 487.34 Cr and a net profit of 29.64 Cr. Shareholder's funds are 215.39 Cr, and total assets amount to 489.56 Cr.

As of 14th August, Haldyn Glass Ltd has a market capitalization of 680.50 Cr, categorizing it as a Micro Cap company.<BR><BR>In the latest four quarters, Haldyn Glass reported Net Sales of 487.34 Cr and a Net Profit of 29.64 Cr.<BR><BR>The latest annual reporting period for the balance sheet is March 2025, with Shareholder's Funds amounting to 215.39 Cr and Total Assets of 489.56 Cr.

View full answer

Are Haldyn Glass Ltd latest results good or bad?

04-Aug-2026

Haldyn Glass Ltd's latest Q1 FY27 results are strong, with a 90% year-on-year increase in net profit to ₹10.26 crore and a 20.58% rise in net sales to ₹138.69 crore, alongside improved operating margins and profitability metrics, indicating robust financial health.

Haldyn Glass Ltd's latest results for Q1 FY27 are quite strong, indicating a positive performance overall. The company reported a consolidated net profit of ₹10.26 crore, which is a remarkable 90% increase year-on-year. This significant profit growth is complemented by a net sales figure of ₹138.69 crore, reflecting a 20.58% increase compared to the same quarter last year.<BR><BR>Additionally, the operating margin has improved to 15.88%, marking the highest quarterly margin achieved by the company. This improvement in margins, along with a robust operating profit to interest coverage ratio of 7.68 times, showcases strong financial health and effective cost management.<BR><BR>The results also highlight a substantial operational strength, with operating profit (excluding other income) rising to ₹22.03 crore from ₹16.73 crore in the previous year. The PAT margin has increased to 7.40%, up from 4.69% a year ago, further underscoring the company's enhanced profitability.<BR><BR>Overall, the financial performance reflects both top-line growth and meaningful margin improvement, positioning Haldyn Glass in a favorable light within the packaging industry.

View full answer

Should I buy, sell or hold Haldyn Glass Ltd?

04-Aug-2026

When is the next results date for Haldyn Glass Ltd?

22-Jul-2026

The next results date for Haldyn Glass Ltd is August 3, 2026.

The next results date for Haldyn Glass Ltd is scheduled for August 3, 2026.

View full answer

Is Haldyn Glass technically bullish or bearish?

25-Nov-2025

As of November 24, 2025, Haldyn Glass is in a bearish trend, supported by weak weekly MACD and KST indicators, bearish daily moving averages, and conflicting monthly RSI signals, indicating significant bearish sentiment overall.

As of 24 November 2025, the technical trend for Haldyn Glass has changed from mildly bearish to bearish. The current stance is bearish with a strong indication of weakness. The weekly MACD and KST are both bearish, supporting the overall bearish outlook. The daily moving averages also confirm this bearish trend. While the monthly RSI shows bullishness, it is overshadowed by the bearish signals from the weekly indicators and the Bollinger Bands, which are bearish on the weekly and mildly bearish on the monthly. The Dow Theory indicates no trend on the weekly chart and mildly bearish on the monthly, further reinforcing the bearish sentiment. Overall, the combination of these indicators suggests a significant bearish stance for Haldyn Glass at this time.

View full answer

Is Haldyn Glass overvalued or undervalued?

13-Nov-2025

As of November 12, 2025, Haldyn Glass is considered undervalued with a PE Ratio of 23.65 and an EV to EBITDA of 9.51, making it a compelling investment opportunity compared to its expensive peers like Asahi India Glass and Borosil Renewables, despite a year-to-date stock decline of 37.75%.

As of 12 November 2025, Haldyn Glass has moved from an attractive to a very attractive valuation grade. The company is currently considered undervalued, especially when compared to its peers in the packaging industry. Key ratios include a PE Ratio of 23.65, an EV to EBITDA of 9.51, and a PEG Ratio of 0.00, indicating strong potential for growth relative to its price.<BR><BR>In comparison, Asahi India Glass, which is categorized as very expensive, has a PE Ratio of 86.12 and an EV to EBITDA of 35.36, while Borosil Renewables is also very expensive with a PE Ratio of 233.48 and an EV to EBITDA of 51.11. Haldyn Glass's valuation metrics suggest it is positioned favorably against these peers, reinforcing its undervalued status. Despite recent stock performance trailing the Sensex, particularly with a year-to-date decline of 37.75% compared to the Sensex's 8.10% gain, the company's fundamentals indicate a compelling investment opportunity.

View full answer

How has been the historical performance of Haldyn Glass?

12-Nov-2025

Haldyn Glass has shown significant growth in net sales and operating profit, with net sales reaching 381.60 Cr in March 2025, up from 298.77 Cr in March 2024. However, profitability has declined due to rising costs, with profit before tax decreasing to 17.71 Cr in March 2025 from 27.06 Cr in the previous year.

Answer:<BR>The historical performance of Haldyn Glass shows a fluctuating trend in key financial metrics over the years, with notable growth in net sales and operating profit in recent periods.<BR><BR>Breakdown:<BR>Haldyn Glass reported net sales of 381.60 Cr in March 2025, a significant increase from 298.77 Cr in March 2024 and 319.92 Cr in March 2023, reflecting a strong upward trend in revenue. The total operating income followed a similar pattern, reaching 381.60 Cr in March 2025, up from 298.77 Cr in the previous year. However, the company's total expenditure also rose to 327.90 Cr in March 2025, compared to 258.98 Cr in March 2024, driven by increased raw material costs and other expenses. Operating profit (PBDIT) increased to 61.42 Cr in March 2025 from 55.38 Cr in March 2024, indicating improved operational efficiency. Profit before tax decreased to 17.71 Cr in March 2025 from 27.06 Cr in March 2024, while profit after tax also fell to 13.59 Cr from 19.16 Cr in the same period. The company’s total assets grew to 489.56 Cr in March 2025, up from 449.59 Cr in March 2024, alongside total liabilities which increased to 489.56 Cr from 449.59 Cr. Cash flow from operating activities improved to 44.00 Cr in March 2025, compared to 18.00 Cr in March 2024, highlighting a positive cash generation trend. Overall, while Haldyn Glass has shown growth in sales and operating profit, it faces challenges in maintaining profitability amidst rising costs.

View full answer

Who are the top shareholders of the Haldyn Glass?

17-Jul-2025

The top shareholder of Haldyn Glass is Haldyn Corporation Limited, owning 54.91% of the shares, followed by individual investors with 30.24%. The highest public shareholder is Dalmus Performance Focused Fund at 1.62%, with no mutual funds or foreign institutional investors involved.

The top shareholders of Haldyn Glass include Haldyn Corporation Limited, which holds the largest stake at 54.91%. This makes it the primary promoter of the company. Additionally, individual investors collectively own 30.24% of the shares. The highest public shareholder is Dalmus Performance Focused Fund, with a holding of 1.62%. Notably, there are no mutual funds or foreign institutional investors currently holding shares in the company.

View full answer

Has Haldyn Glass declared dividend?

06-Jun-2025

Haldyn Glass Ltd has declared a 70% dividend, amounting to ₹0.7 per share, with an ex-date of September 12, 2024. While recent total returns show volatility with negative performance in the 6-month and 1-year periods, the company has demonstrated substantial growth over the longer term, particularly a total return of 363.63% over the past 5 years.

Haldyn Glass Ltd has declared a 70% dividend.<BR><BR>Dividend Details:<BR>- Percentage announced: 70%<BR>- Amount per share: 0.7<BR>- Ex-date: 12 Sep 2024<BR><BR>Dividend Yield: 0.69%.<BR><BR>Total Returns by Period:<BR>In the 6-month period, Haldyn Glass experienced a price return of -40.15%, a dividend return of 0%, resulting in a total return of -40.15%.<BR><BR>Over the 1-year period, the company had a price return of -24.76%, a dividend return of 0.52%, leading to a total return of -24.24%.<BR><BR>For the 2-year period, the price return was 40.65%, with a dividend return of 1.83%, culminating in a total return of 42.48%.<BR><BR>In the 3-year period, the price return stood at 153.87%, while the dividend return was 5.67%, resulting in a total return of 159.54%.<BR><BR>During the 4-year period, Haldyn Glass recorded a price return of 140.66%, a dividend return of 6.52%, and a total return of 147.18%.<BR><BR>Finally, in the 5-year period, the price return was 351.44%, with a dividend return of 12.19%, leading to a total return of 363.63%.<BR><BR>Overall, while Haldyn Glass has declared a dividend, the recent total returns indicate significant volatility, particularly in the shorter time frames, with negative returns in the 6-month and 1-year periods. However, the longer-term returns show substantial growth, particularly over the 5-year period.

View full answer
iScoreScore
Click here to find our call on this stock
Strong Sell
Sell
Hold
Buy
Strong Buy

Dashboard

1

Strong ability to service debt as the company has a low Debt to EBITDA ratio of 1.85 times

 
2

With a growth in Net Profit of 129.54%, the company declared Very Positive results in Jun 26

3

With ROCE of 9.5, it has a Attractive valuation with a 2.5 Enterprise value to Capital Employed

stock-summaryMojo Parameters

Mojo Parameters

Loading Valuation Snapshot...

Stock DNA

stock-summary
Industry

Packaging

stock-summary
Market cap

INR 765 Cr (Micro Cap)

stock-summary
P/E

24.00

stock-summary
Industry P/E

34

stock-summary
Dividend Yield

1.00%

stock-summary
Debt Equity

0.45

stock-summary
Return on Equity

11.17%

stock-summary
Price to Book

3.21

Revenue and Profits:
Net Sales:
139 Cr
(Quarterly Results - Jun 2026)
Net Profit:
10 Cr
stock-summaryTotal Returns
Total Returns (Price + Dividend) stock-summary
Dividend Yield (1%)
TimePeriod
Price Return
Dividend Return
Total Return
3 Months
24.37%
0.62%
24.99%
6 Months
0%
0%
0.0%
1 Year
0%
0%
0.0%
2 Years
0%
0%
0.0%
3 Years
0%
0%
0.0%
4 Years
0%
0%
0.0%
5 Years
0%
0%
0.0%

Latest dividend: 0.6947462473195138 per share ex-dividend date: Aug-28-2026

Risk Adjusted Returns v/s stock-summary
Returns Beta
Icon
Beta has not been calculated since enough price history is not available
stock-summaryKey Factors

Quality key factors stock-summary

Factor
Value
Sales Growth (5y)
20.05%
EBIT Growth (5y)
18.83%
EBIT to Interest (avg)
6.41
Debt to EBITDA (avg)
1.90
Net Debt to Equity (avg)
0.45
Sales to Capital Employed (avg)
1.22
Tax Ratio
22.45%
Dividend Payout Ratio
20.00%
Pledged Shares
0
Institutional Holding
2.03%
ROCE (avg)
8.45%
ROE (avg)
11.02%

Valuation key factors

Factor
Value
P/E Ratio
24
Industry P/E
34
Price to Book Value
3.21
EV to EBIT
22.79
EV to EBITDA
12.63
EV to Capital Employed
2.53
EV to Sales
1.76
PEG Ratio
0.39
Dividend Yield
1.00%
ROCE (Latest)
9.46%
ROE (Latest)
11.17%

Technicals key factors

Indicator
Weekly
Monthly
MACD
Bullish
Bullish
RSI
No Signal
No Signal
Bollinger Bands
Bullish
Bullish
Moving Averages
Bullish (Daily)
KST
Mildly Bearish
Mildly Bullish
Dow Theory
Mildly Bullish
Mildly Bullish
OBV
Bullish
Bullish
stock-summary Technical Indicator Scale: Bearish, Mildly Bearish, Sideways, Mildly Bullish, Bullish  Turned 
stock-summaryShareholding
Shareholding Snapshot : Jun 2026stock-summary
Shareholding Compare (%holding) stock-summary
Majority shareholders

Promoters

Pledged Promoter Holdings

None

Mutual Funds

Held by 0 Schemes

FIIs

Held by 1 FIIs (0.0%)

Promoter with highest holding

Haldyn Corporation Limited (55.91%)

Highest Public shareholder

Umesh Chimanlal Shah Huf (1.52%)

Individual Investors Holdings

30.37%

stock-summaryFinancial
[
  {
    "link": "quarterly",
    "btn_text": "All Quarterly Results",
    "header": "Quarterly Results Snapshot (Consolidated) - Jun'26 - YoY",
    "rhs": [
      {
        "prefix": "Net Sales ",
        "suffix": "YoY Growth in quarter ended Jun 2026 is 20.58% vs 32.45% in Jun 2025",
        "dir": -1
      },
      {
        "prefix": "Consolidated Net Profit ",
        "suffix": "YoY Growth in quarter ended Jun 2026 is 90.00% vs 5.88% in Jun 2025",
        "dir": 1
      }
    ],
    "table": {
      "header": [
        "Jun'26",
        "Jun'25",
        "Change(%)"
      ],
      "body": [
        {
          "field": "Net Sales",
          "val1": "138.69",
          "val2": "115.02",
          "chgp": "20.58%",
          "chgp_class": "positive"
        },
        {
          "field": "Operating Profit (PBDIT) excl Other Income",
          "val1": "22.03",
          "val2": "16.73",
          "chgp": "31.68%",
          "chgp_class": "positive"
        },
        {
          "field": "Interest",
          "val1": "2.87",
          "val2": "3.62",
          "chgp": "-20.72%",
          "chgp_class": "positive"
        },
        {
          "field": "Exceptional Items",
          "val1": "0.00",
          "val2": "0.00",
          "chgp": "",
          "chgp_class": "neutral"
        },
        {
          "field": "Consolidate Net Profit",
          "val1": "10.26",
          "val2": "5.40",
          "chgp": "90.00%",
          "chgp_class": "positive"
        },
        {
          "field": "Operating Profit Margin (Excl OI)",
          "val1": "15.88%",
          "val2": "14.55%",
          "chgp": "1.33%",
          "chgp_class": "positive"
        }
      ]
    }
  },
  {
    "link": "half-yearly",
    "btn_text": "All Half Yearly Results",
    "header": "Half Yearly Results Snapshot (Consolidated) - Sep'25",
    "rhs": [
      {
        "prefix": "Net Sales ",
        "suffix": " Growth in half year ended Sep 2025 is 19.70% vs 61.50% in Sep 2024",
        "dir": -1
      },
      {
        "prefix": "Consolidated Net Profit ",
        "suffix": " Growth in half year ended Sep 2025 is 17.89% vs -14.12% in Sep 2024",
        "dir": 1
      }
    ],
    "table": {
      "header": [
        "Sep'25",
        "Sep'24",
        "Change(%)"
      ],
      "body": [
        {
          "field": "Net Sales",
          "val1": "230.73",
          "val2": "192.75",
          "chgp": "19.70%",
          "chgp_class": "positive"
        },
        {
          "field": "Operating Profit (PBDIT) excl Other Income",
          "val1": "30.26",
          "val2": "27.67",
          "chgp": "9.36%",
          "chgp_class": "positive"
        },
        {
          "field": "Interest",
          "val1": "7.03",
          "val2": "7.20",
          "chgp": "-2.36%",
          "chgp_class": "positive"
        },
        {
          "field": "Exceptional Items",
          "val1": "0.00",
          "val2": "0.00",
          "chgp": "",
          "chgp_class": "neutral"
        },
        {
          "field": "Consolidate Net Profit",
          "val1": "12.19",
          "val2": "10.34",
          "chgp": "17.89%",
          "chgp_class": "positive"
        },
        {
          "field": "Operating Profit Margin (Excl OI)",
          "val1": "13.11%",
          "val2": "14.36%",
          "chgp": "-1.25%",
          "chgp_class": "negative"
        }
      ]
    }
  },
  {
    "link": "nine-monthly",
    "btn_text": "All Nine Monthly Results",
    "header": "Nine Monthly Results Snapshot (Consolidated) - Dec'25",
    "rhs": [
      {
        "prefix": "Net Sales ",
        "suffix": "YoY Growth in nine months ended Dec 2025 is 19.27% vs 38.88% in Dec 2024",
        "dir": -1
      },
      {
        "prefix": "Consolidated Net Profit ",
        "suffix": "YoY Growth in nine months ended Dec 2025 is 21.93% vs -19.60% in Dec 2024",
        "dir": 1
      }
    ],
    "table": {
      "header": [
        "Dec'25",
        "Dec'24",
        "Change(%)"
      ],
      "body": [
        {
          "field": "Net Sales",
          "val1": "355.43",
          "val2": "298.00",
          "chgp": "19.27%",
          "chgp_class": "positive"
        },
        {
          "field": "Operating Profit (PBDIT) excl Other Income",
          "val1": "46.58",
          "val2": "40.01",
          "chgp": "16.42%",
          "chgp_class": "positive"
        },
        {
          "field": "Interest",
          "val1": "10.36",
          "val2": "11.06",
          "chgp": "-6.33%",
          "chgp_class": "positive"
        },
        {
          "field": "Exceptional Items",
          "val1": "-1.83",
          "val2": "0.00",
          "chgp": "",
          "chgp_class": "neutral"
        },
        {
          "field": "Consolidate Net Profit",
          "val1": "17.46",
          "val2": "14.32",
          "chgp": "21.93%",
          "chgp_class": "positive"
        },
        {
          "field": "Operating Profit Margin (Excl OI)",
          "val1": "13.11%",
          "val2": "13.43%",
          "chgp": "-0.32%",
          "chgp_class": "negative"
        }
      ]
    }
  },
  {
    "link": "annual",
    "btn_text": "All Annual Results",
    "header": "Annual Results Snapshot (Consolidated) - Mar'26",
    "rhs": [
      {
        "prefix": "Net Sales ",
        "suffix": "YoY Growth in year ended Mar 2026 is 21.51% vs 27.72% in Mar 2025",
        "dir": -1
      },
      {
        "prefix": "Consolidated Net Profit ",
        "suffix": "YoY Growth in year ended Mar 2026 is 31.69% vs -23.44% in Mar 2025",
        "dir": 1
      }
    ],
    "table": {
      "header": [
        "Mar'26",
        "Mar'25",
        "Change(%)"
      ],
      "body": [
        {
          "field": "Net Sales",
          "val1": "463.67",
          "val2": "381.60",
          "chgp": "21.51%",
          "chgp_class": "positive"
        },
        {
          "field": "Operating Profit (PBDIT) excl Other Income",
          "val1": "62.51",
          "val2": "53.68",
          "chgp": "16.45%",
          "chgp_class": "positive"
        },
        {
          "field": "Interest",
          "val1": "13.37",
          "val2": "14.95",
          "chgp": "-10.57%",
          "chgp_class": "positive"
        },
        {
          "field": "Exceptional Items",
          "val1": "-1.83",
          "val2": "0.00",
          "chgp": "",
          "chgp_class": "neutral"
        },
        {
          "field": "Consolidate Net Profit",
          "val1": "24.77",
          "val2": "18.81",
          "chgp": "31.69%",
          "chgp_class": "positive"
        },
        {
          "field": "Operating Profit Margin (Excl OI)",
          "val1": "13.48%",
          "val2": "14.07%",
          "chgp": "-0.59%",
          "chgp_class": "negative"
        }
      ]
    }
  }
]

Quarterly Results Snapshot (Consolidated) - Jun'26 - YoYstock-summary

Jun'26
Jun'25
Change(%)
Net Sales
138.69
115.02
20.58%
Operating Profit (PBDIT) excl Other Income
22.03
16.73
31.68%
Interest
2.87
3.62
-20.72%
Exceptional Items
0.00
0.00
Consolidate Net Profit
10.26
5.40
90.00%
Operating Profit Margin (Excl OI)
15.88%
14.55%
1.33%
Values in Rs Cr.
Direction Arrows
Net Sales

YoY Growth in quarter ended Jun 2026 is 20.58% vs 32.45% in Jun 2025

Direction Arrows
Consolidated Net Profit

YoY Growth in quarter ended Jun 2026 is 90.00% vs 5.88% in Jun 2025

Half Yearly Results Snapshot (Consolidated) - Sep'25stock-summary

Sep'25
Sep'24
Change(%)
Net Sales
230.73
192.75
19.70%
Operating Profit (PBDIT) excl Other Income
30.26
27.67
9.36%
Interest
7.03
7.20
-2.36%
Exceptional Items
0.00
0.00
Consolidate Net Profit
12.19
10.34
17.89%
Operating Profit Margin (Excl OI)
13.11%
14.36%
-1.25%
Values in Rs Cr.
Direction Arrows
Net Sales

Growth in half year ended Sep 2025 is 19.70% vs 61.50% in Sep 2024

Direction Arrows
Consolidated Net Profit

Growth in half year ended Sep 2025 is 17.89% vs -14.12% in Sep 2024

Nine Monthly Results Snapshot (Consolidated) - Dec'25stock-summary

Dec'25
Dec'24
Change(%)
Net Sales
355.43
298.00
19.27%
Operating Profit (PBDIT) excl Other Income
46.58
40.01
16.42%
Interest
10.36
11.06
-6.33%
Exceptional Items
-1.83
0.00
Consolidate Net Profit
17.46
14.32
21.93%
Operating Profit Margin (Excl OI)
13.11%
13.43%
-0.32%
Values in Rs Cr.
Direction Arrows
Net Sales

YoY Growth in nine months ended Dec 2025 is 19.27% vs 38.88% in Dec 2024

Direction Arrows
Consolidated Net Profit

YoY Growth in nine months ended Dec 2025 is 21.93% vs -19.60% in Dec 2024

Annual Results Snapshot (Consolidated) - Mar'26stock-summary

Mar'26
Mar'25
Change(%)
Net Sales
463.67
381.60
21.51%
Operating Profit (PBDIT) excl Other Income
62.51
53.68
16.45%
Interest
13.37
14.95
-10.57%
Exceptional Items
-1.83
0.00
Consolidate Net Profit
24.77
18.81
31.69%
Operating Profit Margin (Excl OI)
13.48%
14.07%
-0.59%
Values in Rs Cr.
Direction Arrows
Net Sales

YoY Growth in year ended Mar 2026 is 21.51% vs 27.72% in Mar 2025

Direction Arrows
Consolidated Net Profit

YoY Growth in year ended Mar 2026 is 31.69% vs -23.44% in Mar 2025

stock-summaryCompany CV
About Haldyn Glass Ltd stock-summary
stock-summary
Haldyn Glass Ltd
Micro Cap
Packaging
Haldyn Glass Limited was initially incorporated as 'Haldyn Glass Gujarat Limited' on April 25, 1991, which subsequently changed the name to the present name 'Haldyn Glass Limited' effective on December 12, 2011. Haldyn Glass is a major player in the glass container industry. The Company works a plant in Gujarat to produce clear glass containers with an furnace capacity of 160 TPD.
Company Coordinates stock-summary
Company Details
Gavasad Village, Padra Taluka Vadodara Gujarat : 391430
stock-summary
Tel: 91-2662 242339-42
stock-summary
baroda@haldynglass.com
Registrar Details
Mondkar Computers Pvt Ltd , 21 Shakil Niwas , Opp. Satya Saibaba Temple, Mahakali Caves Road, Andheri (E), Mumbai