
Compare Hariom Pipe with Similar Stocks
Dashboard
Healthy long term growth as Net Sales has grown by an annual rate of 41.99% and Operating profit at 32.53%
The company declared positive results in Mar'26 after flat results in Dec'25
With ROCE of 14.1, it has a Very Attractive valuation with a 1.6 Enterprise value to Capital Employed
Despite the size of the company, domestic mutual funds hold only 0% of the company
Market Beating Performance
Stock DNA
Iron & Steel Products
INR 1,296 Cr (Micro Cap)
17.00
NA
0.00%
0.58
11.71%
2.01
Total Returns (Price + Dividend) 
Latest dividend: 0.6 per share ex-dividend date: Sep-13-2024
Risk Adjusted Returns v/s
Returns Beta

News
Hariom Pipe Industries Ltd is Rated Hold
Hariom Pipe Industries Ltd is rated 'Hold' by MarketsMOJO, with this rating last updated on 22 May 2026. However, the analysis and financial metrics discussed here reflect the stock's current position as of 21 June 2026, providing investors with the latest insights into the company’s fundamentals, valuation, financial trends, and technical outlook.
Read full news article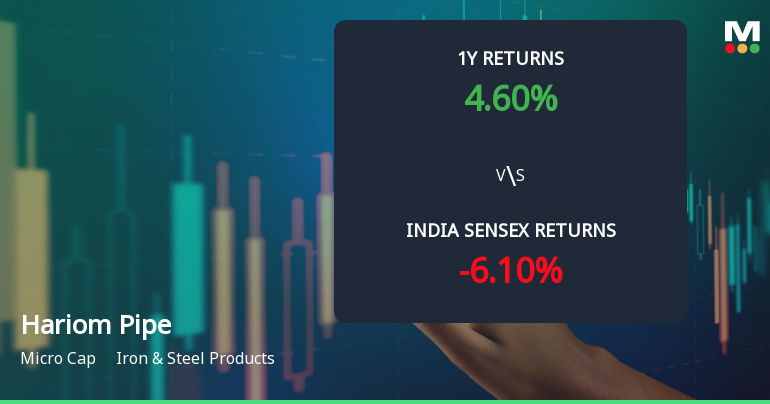
Hariom Pipe Industries Ltd Technical Momentum Shifts Amid Mixed Market Signals
Hariom Pipe Industries Ltd has experienced a notable shift in its technical momentum, moving from a sideways trend to a mildly bullish stance, despite a recent 2.51% decline in its share price. This micro-cap iron and steel products company, currently trading at ₹418.65, presents a complex technical picture with mixed signals across key indicators such as MACD, RSI, moving averages, and Bollinger Bands, warranting a detailed analysis for investors navigating the sector.
Read full news article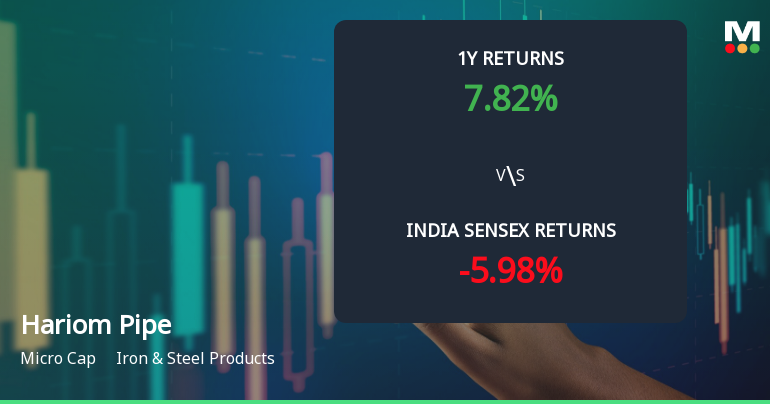
Hariom Pipe Industries Ltd Sees Technical Momentum Shift Amid Mixed Market Signals
Hariom Pipe Industries Ltd has exhibited a notable shift in its technical momentum, moving from a mildly bearish stance to a more sideways trend, supported by a blend of bullish and neutral technical indicators. The stock’s recent price action, combined with evolving momentum signals, suggests a cautious but improving outlook for this micro-cap player in the Iron & Steel Products sector.
Read full news article Announcements
Shareholder Meeting / Postal Ballot-Scrutinizers Report
17-Jun-2026 | Source : BSESubmission of Voting Result and Consolidated Scrutinizer Report of the EGM held on June 16 2026.
Shareholder Meeting / Postal Ballot-Outcome of EGM
16-Jun-2026 | Source : BSESummary of the Proceedings of the Extra- Ordinary General Meeting (EGM) of the Company held on Tuesday June 16 2026.
Announcement under Regulation 30 (LODR)-Newspaper Publication
10-Jun-2026 | Source : BSENewspaper Publication - Corrigendum cum Addendum to the Notice of the Extra-ordinary General Meeting (EGM).
Corporate Actions

No Upcoming Board Meetings

Hariom Pipe Industries Ltd has declared 6% dividend, ex-date: 23 Sep 25

No Splits history available

No Bonus history available

No Rights history available
Quality key factors
Valuation key factors
Technicals key factors
 Technical Indicator Scale: Bearish, Mildly Bearish, Sideways, Mildly Bullish, Bullish Turned
 Shareholding Snapshot : Mar 2026
Shareholding Compare (%holding)
Promoters
None
Held by 0 Schemes
Held by 8 FIIs (9.49%)
Rupesh Kumar Gupta (14.45%)
Malabar India Fund Limited (9.42%)
27.72%
Quarterly Results Snapshot (Consolidated) - Mar'26 - QoQ

QoQ Growth in quarter ended Mar 2026 is 39.80% vs 8.03% in Dec 2025
QoQ Growth in quarter ended Mar 2026 is 159.71% vs 11.34% in Dec 2025
Half Yearly Results Snapshot (Standalone) - Sep'25

Growth in half year ended Sep 2025 is 21.20% vs 21.24% in Sep 2024
Growth in half year ended Sep 2025 is 2.32% vs 10.06% in Sep 2024
Nine Monthly Results Snapshot (Standalone) - Dec'25
YoY Growth in nine months ended Dec 2025 is 21.14% vs 16.43% in Dec 2024
YoY Growth in nine months ended Dec 2025 is 2.58% vs 11.14% in Dec 2024
Annual Results Snapshot (Consolidated) - Mar'26
YoY Growth in year ended Mar 2026 is 22.84% vs 17.68% in Mar 2025
YoY Growth in year ended Mar 2026 is 22.65% vs 8.68% in Mar 2025
About Hariom Pipe Industries Ltd

Company Coordinates


