
Compare Harish Textile with Similar Stocks
Dashboard
High Debt company with Weak Long Term Fundamental Strength
- Poor long term growth as Net Sales has grown by an annual rate of 11.10% over the last 5 years
- High Debt Company with a Debt to Equity ratio (avg) of 3.59 times
- The company has been able to generate a Return on Equity (avg) of 9.72% signifying low profitability per unit of shareholders funds
With a growth in Net Profit of 22.52%, the company declared Very Positive results in Mar 26
With ROCE of 25, it has a Very Attractive valuation with a 1.2 Enterprise value to Capital Employed
Majority shareholders : Non Institution
Stock DNA
Industrial Manufacturing
INR 22 Cr (Micro Cap)
4.00
16
0.00%
2.03
38.37%
1.54
Total Returns (Price + Dividend) 
Harish Textile for the last several years.
Risk Adjusted Returns v/s
Returns Beta

News

Harish Textile Engineers Ltd Reports Very Positive Quarterly Financial Performance Amid Market Volatility
Harish Textile Engineers Ltd has demonstrated a marked improvement in its financial performance for the quarter ended March 2026, signalling a shift from a positive to a very positive financial trend. The company posted record quarterly figures in net sales, profit after tax, and earnings per share, reflecting robust operational execution despite a challenging industrial manufacturing environment.
Read full news article
Harish Textile Engineers Ltd Reports Strong Quarterly Gains Amid Positive Financial Trend
Harish Textile Engineers Ltd has demonstrated a marked improvement in its financial performance for the quarter ended March 2026, registering its highest-ever quarterly net sales and profit after tax. This positive momentum has prompted an upgrade in its financial trend assessment and a revision of its mojo grade from Sell to Hold, signalling cautious optimism among investors.
Read full news article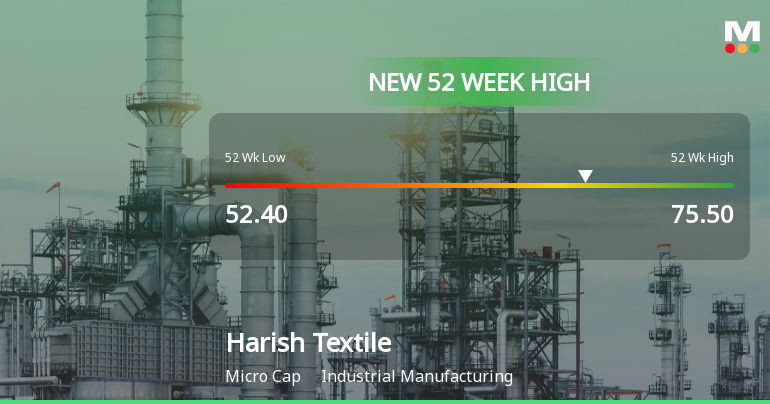
Broad-Based Technical Strength Lifts Harish Textile Engineers Ltd to 52-Week High of Rs 75.5
With a decisive gap-up opening and a 16.15% intraday surge, Harish Textile Engineers Ltd has reached a new 52-week high of Rs 75.5 on 1 Jun 2026, marking a significant milestone in its price momentum despite a modest one-year return of -1.81% compared to the Sensex's -7.98% over the same period.
Read full news article Announcements
Disclosure Under Regulation 30 Of The Securities And Exchange Board Of India (Listing Obligations And Disclosure Requirements) Regulations 2015
03-Jun-2026 | Source : BSEPlease find enclosed herewith intimation for hearing adjourned in the matter of M/s. Kamlesh Corporation.
Additional Disclosure/Clarification Pursuant To Regulation 30 Of SEBI (LODR) Regulations 2015
02-Jun-2026 | Source : BSEPlease find attached herewith Clarification pursuant to Regulation 30 of SEBI (LODR) Regulations 2025 in reference to earlier intimation dated 01st June 2026.
Announcement under Regulation 30 (LODR)-Newspaper Publication
01-Jun-2026 | Source : BSEPlease find enclosed herewith Newspaper Advertisement for Adoption of Financial Results for quarter and year ended on 31st March 2026.
Corporate Actions

No Upcoming Board Meetings

No Dividend history available

No Splits history available

No Bonus history available

No Rights history available
Quality key factors
Valuation key factors
Technicals key factors
 Technical Indicator Scale: Bearish, Mildly Bearish, Sideways, Mildly Bullish, Bullish Turned
 Shareholding Snapshot : Mar 2026
Shareholding Compare (%holding)
Non Institution
None
Held by 2 Schemes (0.05%)
Held by 0 FIIs
Sandeep Kirtikumar Gandhi (48.1%)
Ram Pal Naraniwal (2.86%)
45.47%
Quarterly Results Snapshot (Standalone) - Mar'26 - QoQ

QoQ Growth in quarter ended Mar 2026 is 2.86% vs 0.94% in Dec 2025

QoQ Growth in quarter ended Mar 2026 is 22.52% vs 48.04% in Dec 2025
Half Yearly Results Snapshot (Standalone) - Sep'25
Growth in half year ended Sep 2025 is 1.11% vs 8.49% in Sep 2024
Growth in half year ended Sep 2025 is 344.94% vs -271.15% in Sep 2024
Nine Monthly Results Snapshot (Standalone) - Dec'25
YoY Growth in nine months ended Dec 2025 is 2.84% vs 4.31% in Dec 2024
YoY Growth in nine months ended Dec 2025 is 388.28% vs -337.04% in Dec 2024
Annual Results Snapshot (Standalone) - Mar'26
YoY Growth in year ended Mar 2026 is 4.89% vs 0.76% in Mar 2025
YoY Growth in year ended Mar 2026 is 2,208.33% vs 164.86% in Mar 2025
About Harish Textile Engineers Ltd

Company Coordinates


