
Compare Harri. Malayalam with Similar Stocks
Dashboard
Weak Long Term Fundamental Strength with a -18.93% CAGR growth in Operating Profits over the last 5 years
- Low ability to service debt as the company has a high Debt to EBITDA ratio of 4.46 times
- The company has been able to generate a Return on Capital Employed (avg) of 7.21% signifying low profitability per unit of total capital (equity and debt)
Stock DNA
Industrial Products
INR 402 Cr (Micro Cap)
14.00
59
0.00%
0.60
16.31%
2.35
Total Returns (Price + Dividend) 
Latest dividend: 1.0000 per share ex-dividend date: Aug-21-2014
Risk Adjusted Returns v/s
Returns Beta

News
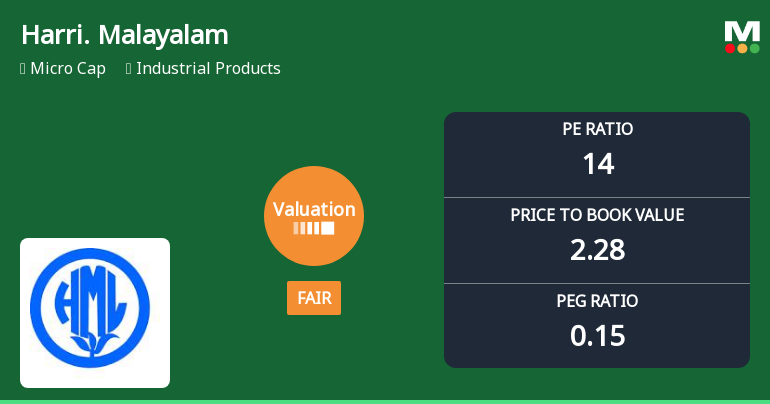
Harrisons Malayalam Ltd Valuation Shifts to Fair Amid Strong Price Gains
Harrisons Malayalam Ltd, a micro-cap player in the industrial products sector, has witnessed a notable shift in its valuation parameters, moving from an attractive to a fair rating. This change comes amid a strong price rally that has outpaced the broader market, prompting a reassessment of its price-to-earnings and price-to-book value multiples relative to historical and peer benchmarks.
Read full news article
Harrisons Malayalam Ltd is Rated Sell
Harrisons Malayalam Ltd is rated Sell by MarketsMOJO, with this rating last updated on 29 June 2026. However, the analysis and financial metrics discussed here reflect the stock's current position as of 11 July 2026, providing investors with the most up-to-date view of the company’s fundamentals, returns, and market performance.
Read full news article
MarketsMOJO Downgrades Harrisons Malayalam Ltd to Sell Amid Mixed Financial and Technical Signals
Harrisons Malayalam Ltd, a micro-cap player in the Industrial Products sector, has seen its investment rating downgraded from Hold to Sell as of 29 June 2026. This shift reflects a combination of deteriorating technical indicators, weak long-term financial fundamentals, and valuation concerns despite some recent positive quarterly results. The company’s current Mojo Score stands at 40.0, signalling caution for investors amid a challenging market environment.
Read full news article Announcements
Compliances-Certificate under Reg. 74 (5) of SEBI (DP) Regulations 2018
03-Jul-2026 | Source : BSEIntimation of Certificate under Regulation 74(5) of SEBI (DP) Regulations 2018.
Closure of Trading Window
25-Jun-2026 | Source : BSEStock Exchange Intimation under SEBI(Prohibition of Insider Trading) Regulations 2015 regarding closure of trading window for the first quarter ended 30th June 2026.
Compliances-Reg.24(A)-Annual Secretarial Compliance
29-May-2026 | Source : BSEAttaching herewith the Annual Secretarial Report for the year ended March 31 2026.
Corporate Actions

No Upcoming Board Meetings

Harrisons Malayalam Ltd has declared 10% dividend, ex-date: 21 Aug 14

No Splits history available

No Bonus history available

No Rights history available
Quality key factors
Valuation key factors
Technicals key factors
 Technical Indicator Scale: Bearish, Mildly Bearish, Sideways, Mildly Bullish, Bullish Turned
 Shareholding Snapshot : Mar 2026
Shareholding Compare (%holding)
Promoters
None
Held by 1 Schemes (0.04%)
Held by 1 FIIs (0.0%)
Rainbow Investments Ltd (24.96%)
Hitesh Ramji Javeri (3.09%)
37.4%
Quarterly Results Snapshot (Consolidated) - Mar'26 - QoQ

QoQ Growth in quarter ended Mar 2026 is 4.28% vs 4.98% in Dec 2025

QoQ Growth in quarter ended Mar 2026 is 19.24% vs 19.00% in Dec 2025
Half Yearly Results Snapshot (Consolidated) - Sep'25
Growth in half year ended Sep 2025 is 6.77% vs 7.98% in Sep 2024
Growth in half year ended Sep 2025 is 925.33% vs 66.06% in Sep 2024
Nine Monthly Results Snapshot (Consolidated) - Dec'25
YoY Growth in nine months ended Dec 2025 is 3.91% vs 8.66% in Dec 2024
YoY Growth in nine months ended Dec 2025 is 106.39% vs 329.20% in Dec 2024
Annual Results Snapshot (Consolidated) - Mar'26
YoY Growth in year ended Mar 2026 is 4.90% vs 5.28% in Mar 2025
YoY Growth in year ended Mar 2026 is 95.63% vs 303.97% in Mar 2025
About Harrisons Malayalam Ltd

Company Coordinates


