
Compare HDFC Bank with Similar Stocks
Dashboard
Strong Long Term Fundamental Strength with an average Return on Assets (ROA) of 1.80%
- Healthy long term growth as Net profit has grown by an annual rate of 18.61%
- The Bank has a high Capital Adequacy Ratio of 17.28% signifying high buffers against its risk based assets
Positive results in Jun 26
With ROA of 1.7, it has a Attractive valuation with a 2 Price to Book Value
High Institutional Holdings at 83.75%
Below par performance in long term as well as near term
Stock DNA
Private Sector Bank
INR 1,158,159 Cr (Large Cap)
1.74%
17.80%
1.72%
0.41%
1.17%
Total Returns (Price + Dividend) 
Latest dividend: 13 per share ex-dividend date: Jun-19-2026
Risk Adjusted Returns v/s
Returns Beta

News
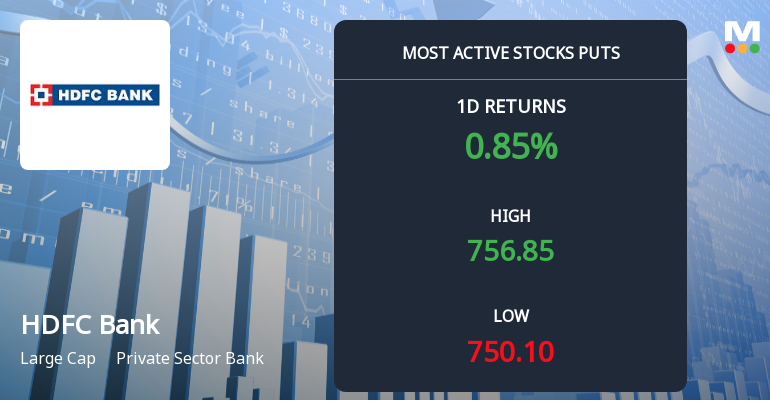
Rs 750 Puts — Slightly Below Current Price — Draw 5,838 Contracts on HDFC Bank Ltd.
Rs 750 put options on HDFC Bank Ltd. attracted 5,838 contracts on 3 Aug 2026, with the stock trading at Rs 755. This strike sits just below the current price, suggesting a nuanced interpretation of the put activity beyond simple bearish bets.
Read full news article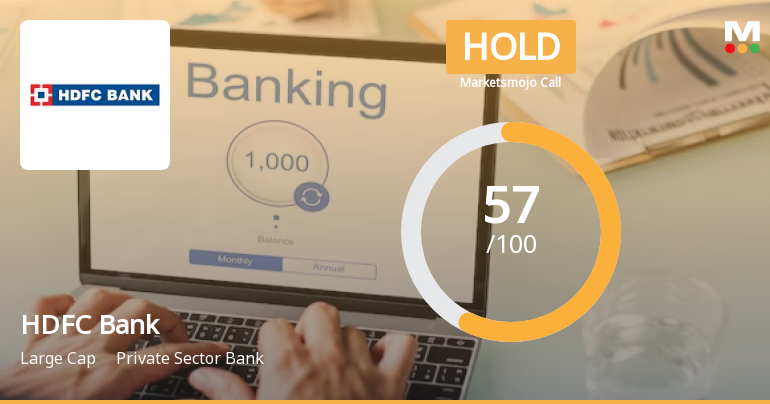
HDFC Bank Ltd. is Rated Hold by MarketsMOJO
HDFC Bank Ltd. is rated 'Hold' by MarketsMOJO, with this rating last updated on 27 February 2026. However, the analysis and financial metrics discussed here reflect the stock's current position as of 03 August 2026, providing investors with an up-to-date view of the company’s fundamentals, valuation, financial trends, and technical outlook.
Read full news article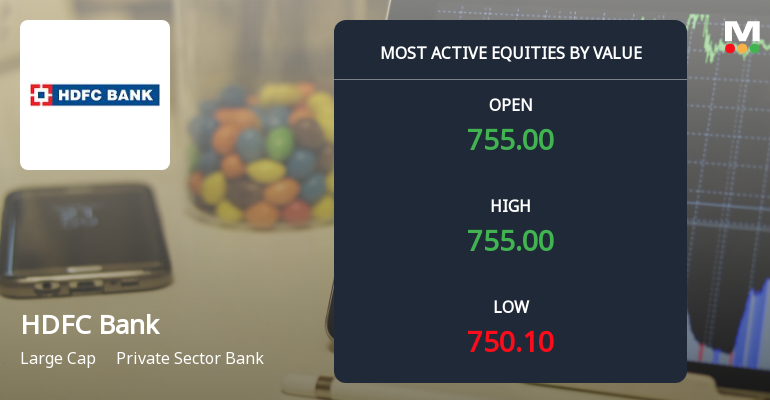
HDFC Bank Ltd. Sees High-Value Trading Amid Mixed Technical Signals
HDFC Bank Ltd., a stalwart in the private sector banking industry, witnessed significant trading activity on 3 August 2026, with a total traded volume exceeding 24.5 lakh shares and a turnover of ₹184.5 crores. Despite this robust value turnover, the stock’s price performance showed a modest gain of 0.80%, underperforming its sector and the broader Sensex indices, reflecting a nuanced market sentiment towards the large-cap lender.
Read full news article Announcements
HDFC Bank Limited - Analysts/Institutional Investor Meet/Con. Call Updates
09-Dec-2019 | Source : NSEHDFC Bank Limited has informed the Exchange regarding Analysts/Institutional Investor Meet/Con. Call Updates
HDFC Bank Limited - Analysts/Institutional Investor Meet/Con. Call Updates
05-Dec-2019 | Source : NSEHDFC Bank Limited has informed the Exchange regarding Analysts/Institutional Investor Meet/Con. Call Updates
HDFC Bank Limited - Analysts/Institutional Investor Meet/Con. Call Updates
03-Dec-2019 | Source : NSEHDFC Bank Limited has informed the Exchange regarding Analysts/Institutional Investor Meet/Con. Call Updates
Corporate Actions

No Upcoming Board Meetings

HDFC Bank Ltd. has declared 1300% dividend, ex-date: 19 Jun 26

HDFC Bank Ltd. has announced 1:2 stock split, ex-date: 19 Sep 19

HDFC Bank Ltd. has announced 1:1 bonus issue, ex-date: 26 Aug 25

No Rights history available
Quality key factors
Valuation key factors
Technicals key factors
 Technical Indicator Scale: Bearish, Mildly Bearish, Sideways, Mildly Bullish, Bullish Turned
 Shareholding Snapshot : Jun 2026
Shareholding Compare (%holding)
FIIs
None
Held by 748 Schemes (30.62%)
Held by 2263 FIIs (41.83%)
None
Sbi Nifty 50 Etf (7.48%)
13.04%
Quarterly Results Snapshot (Standalone) - Jun'26 - YoY

YoY Growth in quarter ended Jun 2026 is 2.44% vs 6.08% in Jun 2025
YoY Growth in quarter ended Jun 2026 is 4.98% vs 12.24% in Jun 2025
Half Yearly Results Snapshot (Standalone) - Sep'25
Growth in half year ended Sep 2025 is 4.84% vs 26.46% in Sep 2024
Growth in half year ended Sep 2025 is 11.52% vs 18.15% in Sep 2024
Nine Monthly Results Snapshot (Standalone) - Dec'25
YoY Growth in nine months ended Dec 2025 is 3.52% vs 19.37% in Dec 2024
YoY Growth in nine months ended Dec 2025 is 11.50% vs 12.26% in Dec 2024
Annual Results Snapshot (Standalone) - Mar'26
YoY Growth in year ended Mar 2026 is 2.33% vs 16.33% in Mar 2025

YoY Growth in year ended Mar 2026 is 10.87% vs 10.75% in Mar 2025
About HDFC Bank Ltd.

Company Coordinates


