
Compare Health.Global with Similar Stocks
Dashboard
Company's ability to service its debt is weak with a poor EBIT to Interest (avg) ratio of 1.19
- Company's ability to service its debt is weak with a poor EBIT to Interest (avg) ratio of 1.19
- The company has been able to generate a Return on Equity (avg) of 3.63% signifying low profitability per unit of shareholders funds
Healthy long term growth as Operating profit has grown by an annual rate 54.46%
With a growth in Operating Profit of 19.15%, the company declared Very Positive results in Mar 26
With ROCE of 8.8, it has a Attractive valuation with a 4.3 Enterprise value to Capital Employed
High Institutional Holdings at 21.61%
Total Returns (Price + Dividend) 
Health.Global for the last several years.
Risk Adjusted Returns v/s
Returns Beta

News
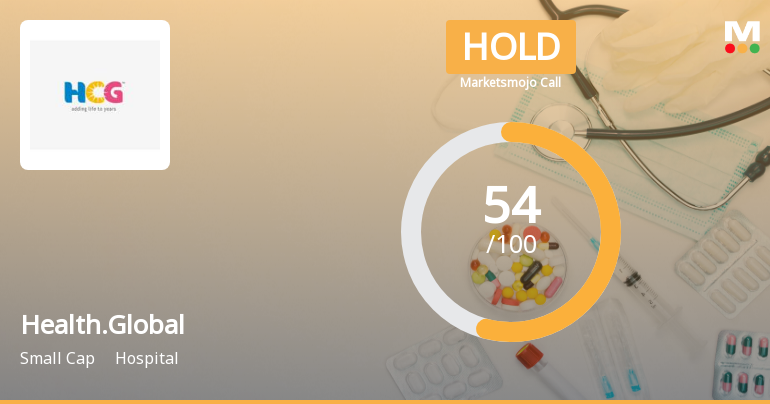
Healthcare Global Enterprises Ltd is Rated Hold
Healthcare Global Enterprises Ltd is rated 'Hold' by MarketsMOJO, with this rating last updated on 20 May 2026. However, the analysis and financial metrics presented here reflect the company’s current position as of 03 July 2026, providing investors with an up-to-date view of its fundamentals, returns, and overall market standing.
Read full news article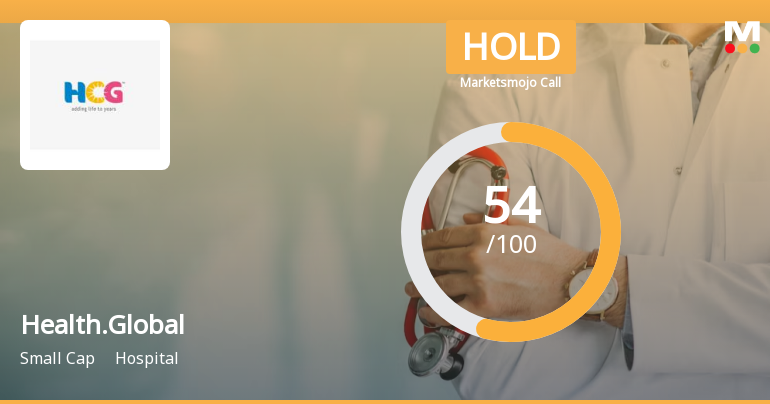
Healthcare Global Enterprises Ltd is Rated Hold by MarketsMOJO
Healthcare Global Enterprises Ltd is rated 'Hold' by MarketsMOJO, with this rating last updated on 20 May 2026. However, the analysis and financial metrics discussed here reflect the company’s current position as of 22 June 2026, providing investors with the most up-to-date view of the stock’s fundamentals, returns, and overall outlook.
Read full news article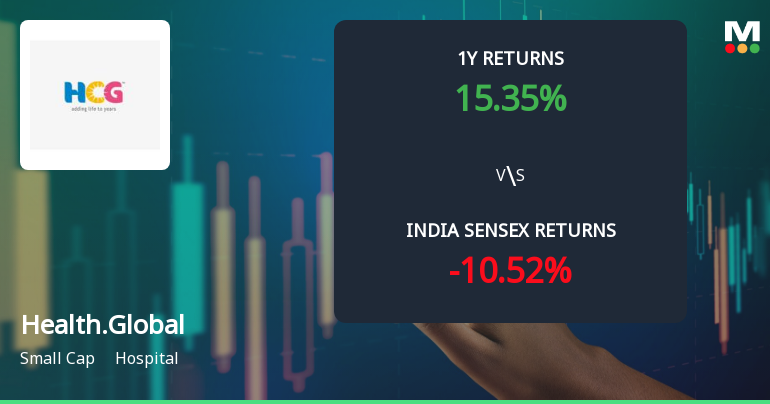
Healthcare Global Enterprises Ltd Technical Momentum Shifts Amid Mixed Signals
Healthcare Global Enterprises Ltd, a small-cap player in the hospital sector, has experienced a subtle shift in its technical momentum, moving from a sideways trend to a mildly bearish stance. Despite a recent downgrade in its technical trend, the company’s longer-term indicators present a nuanced picture, reflecting both bullish and bearish signals across weekly and monthly timeframes.
Read full news article Announcements
Healthcare Global Enterprises Limited - Analysts/Institutional Investor Meet/Con. Call Updates
05-Dec-2019 | Source : NSEHealthcare Global Enterprises Limited has informed the Exchange regarding Analysts/Institutional Investor Meet/Con. Call Updates
Healthcare Global Enterprises Limited - Statement of deviation(s) or variation(s) under Reg. 32
08-Nov-2019 | Source : NSEHealthcare Global Enterprises Limited has informed the Exchange regarding Statement of deviation(s) or variation(s) under Reg. 32 of SEBI (LODR) Regulations 2015
Healthcare Global Enterprises Limited - Analysts/Institutional Investor Meet/Con. Call Updates
04-Nov-2019 | Source : NSEHealthcare Global Enterprises Limited has informed the Exchange regarding Analysts/Institutional Investor Meet/Con. Call Updates
Corporate Actions

No Upcoming Board Meetings

No Dividend history available

No Splits history available

No Bonus history available

Healthcare Global Enterprises Ltd has announced 1:17 rights issue, ex-date: 02 Mar 26
Quality key factors
Valuation key factors
Technicals key factors
 Technical Indicator Scale: Bearish, Mildly Bearish, Sideways, Mildly Bullish, Bullish Turned
 Shareholding Snapshot : Mar 2026
Shareholding Compare (%holding)
Promoters
5.1734
Held by 11 Schemes (15.31%)
Held by 82 FIIs (2.71%)
Hector Asia Holdings Ii Pte. Ltd. (54.27%)
Nippon Life India Trustee Ltd-a/c Nippon India Sma (5.6%)
10.89%
Quarterly Results Snapshot (Consolidated) - Mar'26 - YoY

YoY Growth in quarter ended Mar 2026 is 11.48% vs 18.30% in Mar 2025
YoY Growth in quarter ended Mar 2026 is -70.52% vs -65.38% in Mar 2025
Half Yearly Results Snapshot (Consolidated) - Sep'25

Growth in half year ended Sep 2025 is 16.76% vs 13.88% in Sep 2024
Growth in half year ended Sep 2025 is -30.10% vs 41.97% in Sep 2024
Nine Monthly Results Snapshot (Consolidated) - Dec'25
YoY Growth in nine months ended Dec 2025 is 15.59% vs 15.53% in Dec 2024
YoY Growth in nine months ended Dec 2025 is -68.72% vs 37.83% in Dec 2024
Annual Results Snapshot (Consolidated) - Mar'26
YoY Growth in year ended Mar 2026 is 14.51% vs 16.25% in Mar 2025
YoY Growth in year ended Mar 2026 is -69.02% vs -7.75% in Mar 2025
About Healthcare Global Enterprises Ltd

Company Coordinates


