
Compare Jeena Sikho with Similar Stocks
Dashboard
With ROE of 47.5, it has a Very Expensive valuation with a 15.5 Price to Book Value
- Over the past year, while the stock has generated a return of 28.58%, its profits have risen by 178% ; the PEG ratio of the company is 0.2
Despite the size of the company, domestic mutual funds hold only 0.3% of the company
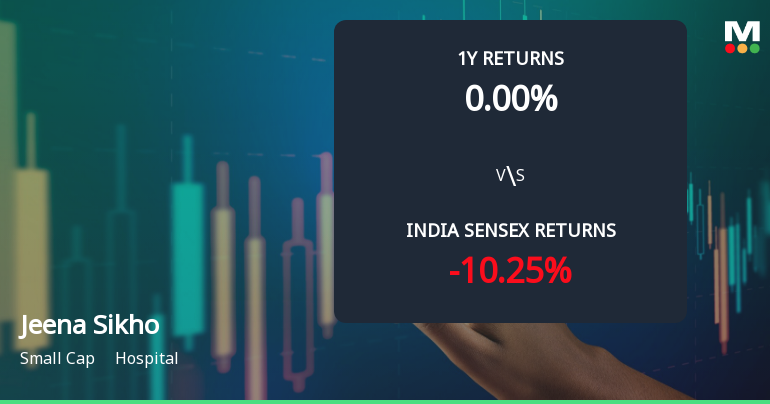
Total Returns (Price + Dividend) 
Latest dividend: 1.1 per share ex-dividend date: Sep-22-2025
Risk Adjusted Returns v/s
Returns Beta

News
Jeena Sikho Lifecare Ltd Faces Bearish Technical Shift Amid Price Momentum Decline
Jeena Sikho Lifecare Ltd, a small-cap player in the hospital sector, has experienced a notable shift in its technical momentum, moving from a mildly bearish stance to a more pronounced bearish trend. This transition is underscored by a combination of weakening moving averages, mixed MACD signals, and subdued RSI readings, signalling caution for investors amid recent price declines.
Read full news article
Jeena Sikho Lifecare Ltd Sees Surge in Value Trading Amid Strong Institutional Interest
Jeena Sikho Lifecare Ltd (JSLL), a small-cap player in the hospital sector, has emerged as one of the most actively traded stocks by value on 4 June 2026, registering a significant uptick in both price and volume. The stock outperformed its sector and broader market indices, reflecting heightened investor interest and robust trading momentum.
Read full news article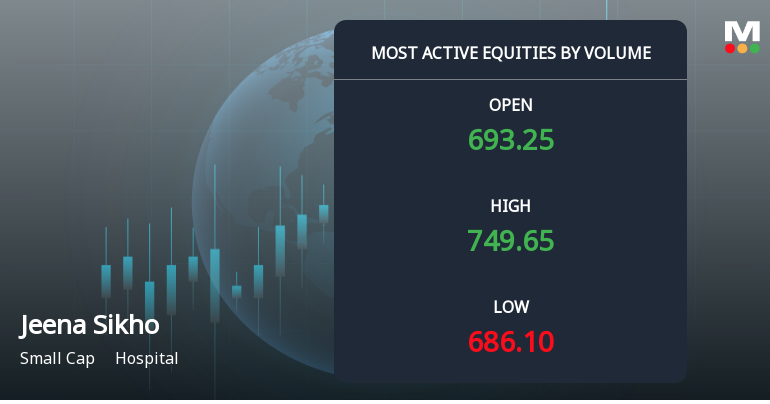
Jeena Sikho Lifecare Ltd Sees Exceptional Volume Surge Amid Strong Price Gains
Jeena Sikho Lifecare Ltd (JSLL) has emerged as one of the most actively traded stocks today, registering a remarkable surge in volume alongside a robust price rally. The hospital sector small-cap stock outperformed its peers and the broader market, signalling heightened investor interest and potential accumulation in the stock.
Read full news article Announcements
Corporate Actions

No Upcoming Board Meetings

Jeena Sikho Lifecare Ltd has declared 55% dividend, ex-date: 22 Sep 25

Jeena Sikho Lifecare Ltd has announced 2:10 stock split, ex-date: 12 Jun 25

Jeena Sikho Lifecare Ltd has announced 4:5 bonus issue, ex-date: 02 Nov 23

No Rights history available
Quality key factors
Valuation key factors
Technicals key factors
 Technical Indicator Scale: Bearish, Mildly Bearish, Sideways, Mildly Bullish, Bullish Turned
 Shareholding Snapshot : Mar 2026
Shareholding Compare (%holding)
Promoters
None
Held by 5 Schemes (0.11%)
Held by 27 FIIs (6.17%)
Manish Grover (63.27%)
Sixteenth Street Asian Gems Fund (5.66%)
18.37%
Quarterly Results Snapshot (Standalone) - Mar'26 - QoQ

QoQ Growth in quarter ended Mar 2026 is -2.76% vs 16.76% in Dec 2025
QoQ Growth in quarter ended Mar 2026 is -32.04% vs 13.51% in Dec 2025
Half Yearly Results Snapshot (Consolidated) - Sep'25
Growth in half year ended Sep 2025 is 70.05% vs 81.77% in Sep 2024

Growth in half year ended Sep 2025 is 159.91% vs 86.48% in Sep 2024
Nine Monthly Results Snapshot (Consolidated) - Dec'25
YoY Growth in nine months ended Dec 2025 is 77.62% vs 9.03% in Dec 2024
YoY Growth in nine months ended Dec 2025 is 218.11% vs -1.19% in Dec 2024
Annual Results Snapshot (Consolidated) - Mar'26
YoY Growth in year ended Mar 2026 is 70.84% vs 129.09% in Mar 2025
YoY Growth in year ended Mar 2026 is 177.52% vs 136.65% in Mar 2025
About Jeena Sikho Lifecare Ltd

Company Coordinates


