
Compare Kovai Medical with Similar Stocks
Dashboard
High Management Efficiency with a high ROCE of 20.78%
Strong ability to service debt as the company has a low Debt to EBITDA ratio of 0.96 times
Flat results in Mar 26
With ROE of 20.5, it has a Very Attractive valuation with a 5.4 Price to Book Value
Majority shareholders : Promoters
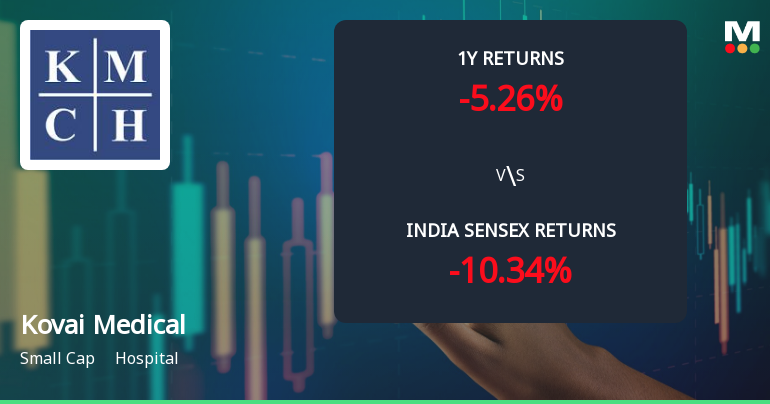
Total Returns (Price + Dividend) 
Latest dividend: 10 per share ex-dividend date: Aug-14-2025
Risk Adjusted Returns v/s
Returns Beta

News
Kovai Medical Center & Hospital Ltd Sees Technical Momentum Shift Amid Mixed Signals
Kovai Medical Center & Hospital Ltd has experienced a notable shift in its technical momentum, moving from a mildly bearish stance to a more sideways trend. This change is underscored by a complex interplay of technical indicators, including MACD, RSI, Bollinger Bands, and moving averages, signalling a nuanced outlook for investors amid recent price gains and evolving market sentiment.
Read full news article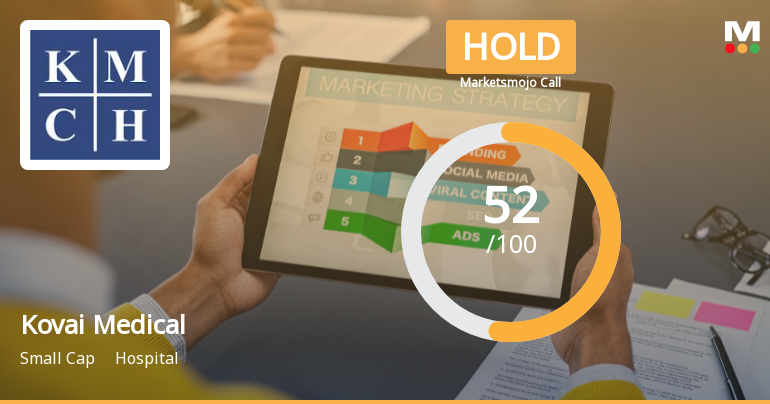
Kovai Medical Center & Hospital Ltd Upgraded to Hold on Technical and Valuation Improvements
Kovai Medical Center & Hospital Ltd has seen its investment rating upgraded from Sell to Hold as of 1 June 2026, reflecting a nuanced improvement across technical indicators, valuation metrics, financial trends, and quality assessments. Despite a flat quarterly financial performance and recent underperformance relative to the broader market, the company’s robust management efficiency and attractive valuation underpin this revised stance.
Read full news article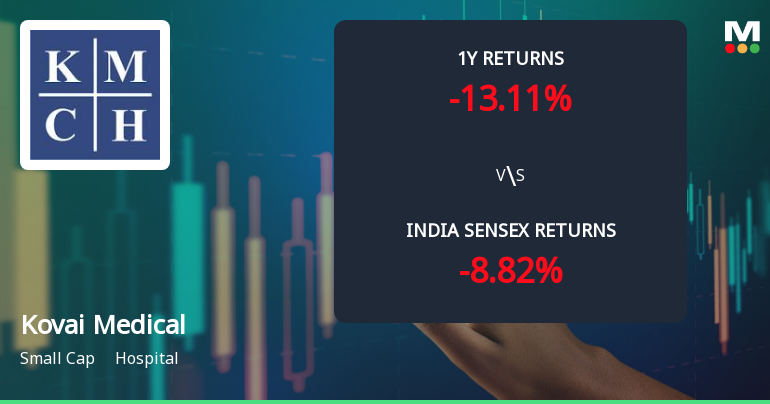
Kovai Medical Center & Hospital Ltd: Technical Momentum Shifts Signal Mixed Outlook
Kovai Medical Center & Hospital Ltd has witnessed a subtle but notable shift in its technical momentum, moving from a bearish stance to a mildly bearish outlook. This transition is underscored by a complex interplay of technical indicators, including MACD, RSI, moving averages, and Bollinger Bands, which collectively paint a nuanced picture of the stock’s near-term prospects amid a challenging market environment.
Read full news article Announcements
Disclosure under Insider Trading Regulation
05-Dec-2014 | Source : NSE
| Kovai Medical Center & Hospital Limited has informed the Exchange the details of change in the shareholding of Dr. Thavamani Devi Palaniswami (Purchase of 300 shares), in terms of Regulation 13(6) of SEBI (Prohibition of Insider Trading) Regulations, 1992. The Company has further submited to the Exchange the disclosure received from Dr. Thavamani Devi Palaniswami , in terms of Regulations 13(4),13(4A) and 13(6) of SEBI (Prohibition of Insider Trading) Regulations, 1992, for the above transaction. (Source MSE) |
Annual General Meeting Updates
17-Oct-2014 | Source : NSE
| Kovai Medical Center & Hospital Limited has submitted to the Exchange the Proceedings of the 28th Annual General Meeting of the Company held on 3rd September 2014, along with a copy of Chariman's Speech delivered at that meeting (Source MSE) |
Discl. under SEBI Insider Trading and Takeover Regulation
25-Sep-2014 | Source : NSE
| Dr. S.K. Sundaramoorthy, belongs to Promoter Group of the Company, has informed the Exchange the change in his shareholding (purchase of 20,000 equity shares of the Company) in the Company, in terms of Reglation 13(4), 13(4A) of SEBI (Prohibition of Insider Trading) Regulations 1992 and Regulation 29(2) of SEBI (Substantial Acquisiion of Shares and Takeovers) Regulations 2011. (Source MSE) |
Corporate Actions

No Upcoming Board Meetings

Kovai Medical Center & Hospital Ltd has declared 100% dividend, ex-date: 14 Aug 25

No Splits history available

No Bonus history available

No Rights history available
Quality key factors
Valuation key factors
Technicals key factors
 Technical Indicator Scale: Bearish, Mildly Bearish, Sideways, Mildly Bullish, Bullish Turned
 Shareholding Snapshot : Mar 2026
Shareholding Compare (%holding)
Promoters
None
Held by 8 Schemes (3.12%)
Held by 47 FIIs (1.2%)
Kovai Purani Finance Private Limited (36.97%)
Dsp Healthcare Fund (1.63%)
22.62%
Quarterly Results Snapshot (Standalone) - Mar'26 - QoQ

QoQ Growth in quarter ended Mar 2026 is 1.62% vs 4.06% in Dec 2025
QoQ Growth in quarter ended Mar 2026 is -2.57% vs 10.47% in Dec 2025
Half Yearly Results Snapshot (Standalone) - Sep'25

Growth in half year ended Sep 2025 is 16.09% vs 14.17% in Sep 2024
Growth in half year ended Sep 2025 is 20.38% vs 29.52% in Sep 2024
Nine Monthly Results Snapshot (Standalone) - Dec'25
YoY Growth in nine months ended Dec 2025 is 15.58% vs 12.88% in Dec 2024
YoY Growth in nine months ended Dec 2025 is 17.42% vs 20.92% in Dec 2024
Annual Results Snapshot (Standalone) - Mar'26
YoY Growth in year ended Mar 2026 is 15.65% vs 12.43% in Mar 2025
YoY Growth in year ended Mar 2026 is 16.99% vs 16.26% in Mar 2025
About Kovai Medical Center & Hospital Ltd

Company Coordinates


