
Compare HEC Infra Proj. with Similar Stocks
Dashboard
Healthy long term growth as Net Sales has grown by an annual rate of 36.52% and Operating profit at 61.48%
With a growth in Operating Profit of 13.55%, the company declared Very Positive results in Mar 26
With ROCE of 21.2, it has a Attractive valuation with a 1.6 Enterprise value to Capital Employed
Majority shareholders : Promoters
Below par performance in long term as well as near term
Total Returns (Price + Dividend) 
Latest dividend: 1 per share ex-dividend date: Sep-19-2018
Risk Adjusted Returns v/s
Returns Beta

News
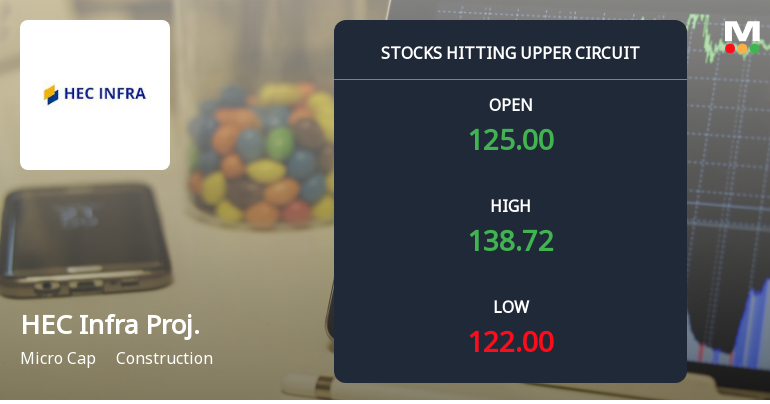
HEC Infra Projects Ltd Locks at Upper Circuit With 20% Gain — Buyers Queue, Sellers Absent
At Rs 138.72, the buying was done — not because demand dried up, but because the exchange wouldn't let the stock go any higher. HEC Infra Projects Ltd locked at its upper circuit of 20% on 20 Jul 2026, with buyers queuing and no sellers willing to part with shares.
Read full news article
HEC Infra Projects Ltd is Rated Buy
HEC Infra Projects Ltd is rated Buy by MarketsMOJO, with this rating last updated on 18 June 2026. While the rating change occurred on that date, the analysis and financial metrics discussed here reflect the company’s current position as of 19 July 2026, providing investors with the most up-to-date view of the stock’s fundamentals, returns, and technical outlook.
Read full news article
HEC Infra Projects Ltd is Rated Buy
HEC Infra Projects Ltd is rated Buy by MarketsMOJO, with this rating last updated on 18 June 2026. While the rating change occurred on that date, the analysis and financial metrics discussed here reflect the stock’s current position as of 08 July 2026, providing investors with the latest insights into the company’s performance and outlook.
Read full news article Announcements
HEC Infra Projects Limited - Outcome of Board Meeting
14-Nov-2019 | Source : NSEHEC Infra Projects Limited has informed the Exchange regarding Board meeting held on November 14, 2019.
HEC Infra Projects Limited - Updates
09-Oct-2019 | Source : NSEHEC Infra Projects Limited has informed the Exchange regarding 'Submission under Regulation 74 (5) of SEBI (Depositories and Participants) Regulations, 2018'.
Corporate Actions

No Upcoming Board Meetings

HEC Infra Projects Ltd has declared 10% dividend, ex-date: 19 Sep 18

No Splits history available

HEC Infra Projects Ltd has announced 4:1 bonus issue, ex-date: 07 Oct 21

No Rights history available
Quality key factors
Valuation key factors
Technicals key factors
 Technical Indicator Scale: Bearish, Mildly Bearish, Sideways, Mildly Bullish, Bullish Turned
 Shareholding Snapshot : Jun 2026
Shareholding Compare (%holding)
Promoters
None
Held by 0 Schemes
Held by 0 FIIs
Gaurang Parmanand Shah (52.82%)
Nitin Madhukarbhai Pandya (4.2%)
21.35%
Quarterly Results Snapshot (Standalone) - Mar'26 - YoY

YoY Growth in quarter ended Mar 2026 is 9.10% vs 65.01% in Mar 2025
YoY Growth in quarter ended Mar 2026 is 7.58% vs 2,080.77% in Mar 2025
Half Yearly Results Snapshot (Standalone) - Sep'25

Growth in half year ended Sep 2025 is 79.74% vs 33.40% in Sep 2024
Growth in half year ended Sep 2025 is 72.82% vs 202.94% in Sep 2024
Nine Monthly Results Snapshot (Standalone) - Dec'25
YoY Growth in nine months ended Dec 2025 is 91.71% vs 43.80% in Dec 2024
YoY Growth in nine months ended Dec 2025 is 85.67% vs -21.75% in Dec 2024
Annual Results Snapshot (Standalone) - Mar'26
YoY Growth in year ended Mar 2026 is 57.44% vs 51.92% in Mar 2025
YoY Growth in year ended Mar 2026 is 36.36% vs 95.76% in Mar 2025
About HEC Infra Projects Ltd

Company Coordinates


