
Compare HEG with Similar Stocks
Dashboard
Company has a Debt to Equity ratio (avg) of 0.01 times
Poor long term growth as Operating profit has grown by an annual rate 15.28% of over the last 5 years
Flat results in Mar 26
With ROE of 7.1, it has a Expensive valuation with a 2.1 Price to Book Value
Falling Participation by Institutional Investors
Consistent Returns over the last 3 years
Stock DNA
Electrodes & Refractories
INR 10,183 Cr (Small Cap)
30.00
41
0.34%
0.03
7.07%
2.16
Total Returns (Price + Dividend) 
Latest dividend: 1.7985692995529063 per share ex-dividend date: Aug-13-2025
Risk Adjusted Returns v/s
Returns Beta

News
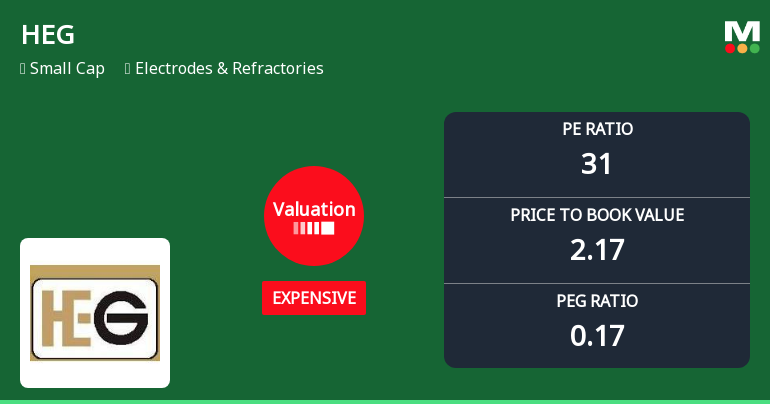
HEG Ltd Valuation Shift Signals Changing Price Attractiveness Amid Market Volatility
HEG Ltd, a key player in the Electrodes & Refractories sector, has witnessed a notable shift in its valuation parameters, moving from a very expensive to an expensive rating. This change reflects evolving market perceptions and invites a closer examination of its price-to-earnings (P/E) and price-to-book value (P/BV) ratios relative to historical trends and peer benchmarks. Investors are advised to consider these valuation dynamics alongside the company’s financial performance and sector outlook.
Read full news article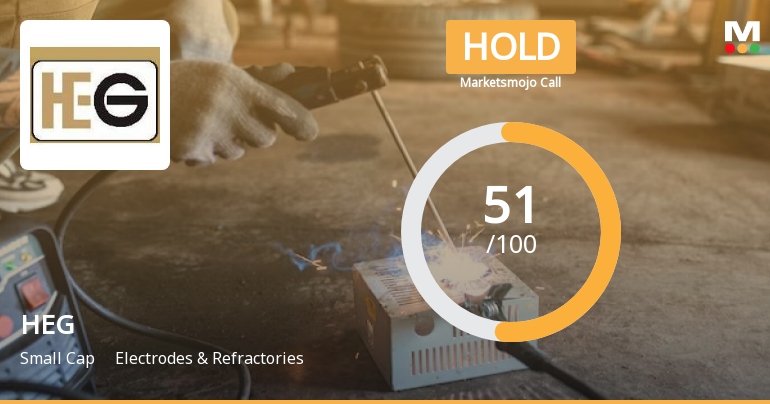
HEG Ltd is Rated Hold by MarketsMOJO
HEG Ltd is rated 'Hold' by MarketsMOJO, with this rating last updated on 29 April 2026. However, the analysis and financial metrics discussed here reflect the stock's current position as of 21 June 2026, providing investors with an up-to-date view of the company’s fundamentals, returns, and market standing.
Read full news article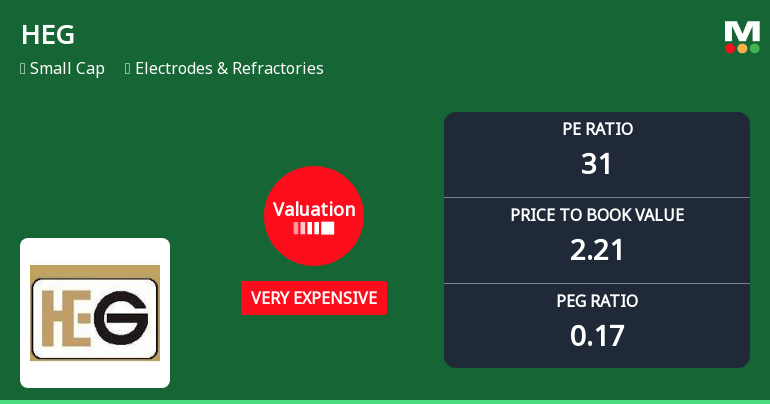
HEG Ltd Valuation Shifts Signal Changing Price Attractiveness Amid Market Volatility
HEG Ltd, a key player in the Electrodes & Refractories sector, has seen its valuation metrics shift notably, moving from an expensive to a very expensive category. Despite a recent day gain of 3.15%, the stock’s price-to-earnings (P/E) and price-to-book value (P/BV) ratios now stand well above industry averages, prompting a downgrade in its Mojo Grade from Buy to Hold as of 15 April 2026. This article analyses the valuation changes in the context of HEG’s financial performance, peer comparisons, and broader market returns.
Read full news article Announcements
Announcement under Regulation 30 (LODR)-Change in Directorate
22-Jun-2026 | Source : BSECompletion of Tenure of Independent Director
Disclosure Under Regulation 30 Of The SEBI (Listing Obligations And Disclosure Requirements) Regulations 2015 - Reconstitution Of Committees Of The Company.
22-Jun-2026 | Source : BSEAttached
Intimation For 54Th Annual General Meeting Scheduled To Be Held Through Video Conferencing/ Other Audio Visual Means (VC/OAVM) Only
22-Jun-2026 | Source : BSEAttached
Corporate Actions

No Upcoming Board Meetings

HEG Ltd has declared 90% dividend, ex-date: 13 Aug 25

HEG Ltd has announced 2:10 stock split, ex-date: 18 Oct 24

No Bonus history available

No Rights history available
Quality key factors
Valuation key factors
Technicals key factors
 Technical Indicator Scale: Bearish, Mildly Bearish, Sideways, Mildly Bullish, Bullish Turned
 Shareholding Snapshot : Mar 2026
Shareholding Compare (%holding)
Promoters
None
Held by 22 Schemes (6.79%)
Held by 129 FIIs (10.24%)
Redrose Vanijya Llp (29.46%)
Sbi Energy Opportunities Fund (3.52%)
16.57%
Quarterly Results Snapshot (Consolidated) - Mar'26 - QoQ

QoQ Growth in quarter ended Mar 2026 is -8.00% vs -6.23% in Dec 2025
QoQ Growth in quarter ended Mar 2026 is -154.97% vs 44.40% in Dec 2025
Half Yearly Results Snapshot (Consolidated) - Sep'25

Growth in half year ended Sep 2025 is 15.55% vs -11.40% in Sep 2024
Growth in half year ended Sep 2025 is 135.60% vs -55.20% in Sep 2024
Nine Monthly Results Snapshot (Consolidated) - Dec'25
YoY Growth in nine months ended Dec 2025 is 21.91% vs -12.48% in Dec 2024
YoY Growth in nine months ended Dec 2025 is 141.15% vs -32.30% in Dec 2024
Annual Results Snapshot (Consolidated) - Mar'26
YoY Growth in year ended Mar 2026 is 19.31% vs -10.11% in Mar 2025
YoY Growth in year ended Mar 2026 is 196.68% vs -63.08% in Mar 2025
About HEG Ltd

Company Coordinates


