
Compare HEG with Similar Stocks
Dashboard
Company has a Debt to Equity ratio (avg) of 0.01 times
Poor long term growth as Operating profit has grown by an annual rate 15.28% of over the last 5 years
Flat results in Mar 26
With ROE of 7.1, it has a Expensive valuation with a 2.1 Price to Book Value
Falling Participation by Institutional Investors
Stock DNA
Electrodes & Refractories
INR 9,823 Cr (Small Cap)
30.00
40
0.35%
0.03
7.07%
2.11
Total Returns (Price + Dividend) 
Latest dividend: 1.8 per share ex-dividend date: Aug-13-2025
Risk Adjusted Returns v/s
Returns Beta

News

HEG Ltd is Rated Hold by MarketsMOJO
HEG Ltd is rated 'Hold' by MarketsMOJO, with this rating last updated on 29 April 2026. However, the analysis and financial metrics discussed here reflect the stock’s current position as of 10 June 2026, providing investors with the latest insights into the company’s performance and outlook.
Read full news article
HEG Ltd is Rated Hold by MarketsMOJO
HEG Ltd is rated 'Hold' by MarketsMOJO, with this rating last updated on 29 Apr 2026. However, the analysis and financial metrics discussed below reflect the stock's current position as of 30 May 2026, providing investors with an up-to-date view of the company’s fundamentals, valuation, financial trends, and technical outlook.
Read full news article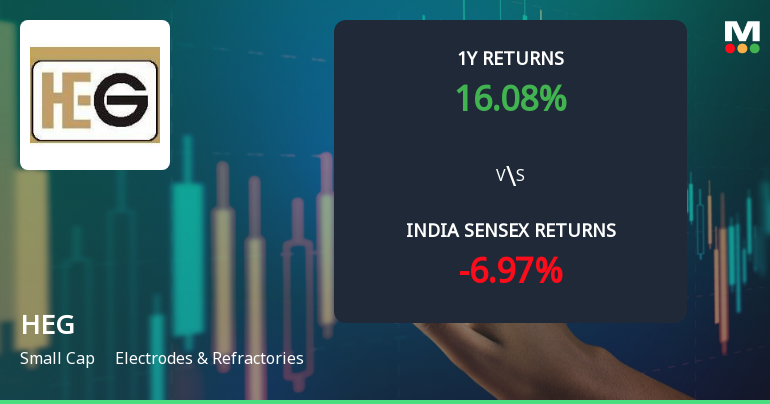
HEG Ltd Technical Momentum Shifts Amid Mixed Indicator Signals
HEG Ltd, a key player in the Electrodes & Refractories sector, has experienced a nuanced shift in its technical momentum, reflecting a transition from a bullish to a mildly bullish trend. Despite a recent downgrade in its Mojo Grade from Buy to Hold, the stock’s technical indicators present a complex picture, with some signals pointing to strength while others suggest caution. This analysis delves into the latest technical parameters, price momentum, and comparative performance against the broader market to provide a comprehensive view for investors.
Read full news article Announcements
Re-Lodgment Of Transfer Requests Of Physical Shares.
06-Jun-2026 | Source : BSEAttached
Announcement under Regulation 30 (LODR)-Press Release / Media Release
02-Jun-2026 | Source : BSEPlease find attached a press release being issued by TACC Limited a Wholly Owned Subsidiary of HEG Limited announcing about signing of MOU with and Institute for functional intellignet Materials (IFIM) at the National University of Singapore (NUS) to collaborate in the fields of advanced materials science nanotechnolgoy and related disciplines
Email Communication To Shareholders Regarding Amendment In Taxation Provisions Relating To Dividend
27-May-2026 | Source : BSEAttached
Corporate Actions

No Upcoming Board Meetings

HEG Ltd has declared 90% dividend, ex-date: 13 Aug 25

HEG Ltd has announced 2:10 stock split, ex-date: 18 Oct 24

No Bonus history available

No Rights history available
Quality key factors
Valuation key factors
Technicals key factors
 Technical Indicator Scale: Bearish, Mildly Bearish, Sideways, Mildly Bullish, Bullish Turned
 Shareholding Snapshot : Mar 2026
Shareholding Compare (%holding)
Promoters
None
Held by 22 Schemes (6.79%)
Held by 129 FIIs (10.24%)
Redrose Vanijya Llp (29.46%)
Sbi Energy Opportunities Fund (3.52%)
16.57%
Quarterly Results Snapshot (Consolidated) - Mar'26 - QoQ

QoQ Growth in quarter ended Mar 2026 is -8.00% vs -6.23% in Dec 2025
QoQ Growth in quarter ended Mar 2026 is -154.97% vs 44.40% in Dec 2025
Half Yearly Results Snapshot (Consolidated) - Sep'25

Growth in half year ended Sep 2025 is 15.55% vs -11.40% in Sep 2024
Growth in half year ended Sep 2025 is 135.60% vs -55.20% in Sep 2024
Nine Monthly Results Snapshot (Consolidated) - Dec'25
YoY Growth in nine months ended Dec 2025 is 21.91% vs -12.48% in Dec 2024
YoY Growth in nine months ended Dec 2025 is 141.15% vs -32.30% in Dec 2024
Annual Results Snapshot (Consolidated) - Mar'26
YoY Growth in year ended Mar 2026 is 19.31% vs -10.11% in Mar 2025
YoY Growth in year ended Mar 2026 is 196.68% vs -63.08% in Mar 2025
About HEG Ltd

Company Coordinates


