Heranba Inds

  • Market Cap: Micro Cap
  • Industry: Pesticides & Agrochemicals
  • ISIN: INE694N01015
  • NSEID: HERANBA
  • BSEID: 543266
INR
178.01
3.26 (1.87%)
BSENSE

Mar 25

BSE+NSE Vol: 88.94 k

  • Price Points
  • Score
  • Mojo Parameters
  • Total Return
  • News and Corporate Actions
  • Key factors
  • Shareholding
  • Financials
  • CompanyCV
stock-summaryPrice Point
High/Low

1Day

52 Week

Valuation
Technical
Day's Volume

CASH

88.94 k (-0.83%) Volume

Shareholding (Dec 2025)

FII

0.08%

Held by 4 FIIs

DII

0.27%

Held by 0 DIIs

Promoter

74.94%

What does Heranba Inds do?

06-Jun-2025

Heranba Industries Ltd manufactures and sells agrochemical products, primarily synthetic pyrethroids. As of March 2025, it reported net sales of ₹335 Cr and a net loss of ₹41 Cr, with a market cap of ₹1,168 Cr.

Overview:<BR>Heranba Industries Ltd is engaged in the manufacturing and sale of agrochemical products, specifically synthetic pyrethroids and their intermediates, operating within the small-cap pesticides and agrochemicals industry.<BR><BR>History:<BR>Incorporated in 1992, Heranba Industries Ltd has been involved in the agrochemical sector since its inception. The latest quarterly results reported are for March 2025, showing net sales and profit figures.<BR><BR>Financial Snapshot:<BR>- Net Sales: 335 Cr (Quarterly Results - Mar 2025)<BR>- Net Profit: -41 Cr (Quarterly Results - Mar 2025)<BR>- Market Cap: Rs 1,168 Cr (Small Cap)<BR><BR>Key Metrics:<BR>- P/E: 383.00<BR>- Industry P/E: 38<BR>- Dividend Yield: 0.41%<BR>- Debt Equity: 0.35<BR>- Return on Equity: 0.36%<BR>- Price to Book: 1.39<BR><BR>Contact Details:<BR>- Address: Plot No 1504/1505/1506/1, GIDC Phase-III Vapi Valsad Gujarat : 396195<BR>- Tel: 91-260-2401646<BR>- Email: compliance@heranba.com<BR>- Website: http://www.heranba.co.in

View full answer

Has Heranba Inds declared dividend?

06-Jun-2025

Heranba Industries Ltd has declared a 12% dividend, amounting to ₹1.2 per share, with an ex-date of September 5, 2024. However, the company has experienced significant price declines over various periods, resulting in negative total returns despite the dividend.

Heranba Industries Ltd has declared a 12% dividend.<BR><BR>Dividend Details:<BR>- Percentage announced: 12%<BR>- Amount per share: 1.2<BR>- Ex-date: 05 Sep 24<BR><BR>Dividend Yield: 0.41%.<BR><BR>Total Returns by Period:<BR>In the last 6 months, the price return was -40.43%, with a dividend return of 0%, resulting in a total return of -40.43%.<BR><BR>Over the past year, the price return was -2.21%, the dividend return was 0.37%, leading to a total return of -1.84%.<BR><BR>In the 2-year period, the price return was -14.74%, the dividend return was 0.62%, culminating in a total return of -14.12%.<BR><BR>For the 3-year period, the price return was -49.55%, with a dividend return of 0.84%, resulting in a total return of -48.71%.<BR><BR>In the 4-year period, the price return was -61.88%, the dividend return was 0.74%, leading to a total return of -61.14%.<BR><BR>Over the last 5 years, the price return was 0%, with a dividend return of 0%, resulting in a total return of 0.0%.<BR><BR>Overall, while Heranba Industries Ltd has declared a dividend, the total returns over various periods indicate significant declines in price returns, with only modest contributions from dividend returns. This suggests a challenging performance landscape for the company.

View full answer

Who are the peers of the Heranba Inds?

03-Jun-2025

Heranba Inds' peers include P I Industries, UPL, Bayer CropSci., and others. Management risk varies from excellent at P I Industries to below average at Shivalik Rasayan, with Heranba Inds showing average risk and a 1-year return of 1.24%.

Peers: The peers of Heranba Inds are P I Industries, UPL, Bayer CropSci., Sumitomo Chemi., Dhanuka Agritech, Dharmaj Crop, Shivalik Rasayan, Best Agrolife, Ambey, and Aristo Bio-Tech.<BR><BR>Quality Snapshot: Excellent management risk is observed at P I Industries, Bayer CropSci., Dhanuka Agritech, and the rest. Good management risk is found at Sumitomo Chemi., Best Agrolife, Ambey, and the rest. Average management risk is present at UPL, Heranba Inds, Dharmaj Crop, and the rest. Below Average management risk is noted at Shivalik Rasayan. For growth, Excellent growth is seen at P I Industries, while Average growth is found at Dharmaj Crop and the rest. Below Average growth is observed at UPL, Bayer CropSci., Sumitomo Chemi., Dhanuka Agritech, Heranba Inds, Shivalik Rasayan, Best Agrolife, Ambey, and Aristo Bio-Tech. Capital Structure ratings show Excellent at Bayer CropSci., Sumitomo Chemi., Dhanuka Agritech, and the rest, Good at Heranba Inds, Dharmaj Crop, and the rest, and Below Average at Aristo Bio-Tech.<BR><BR>Return Snapshot: Dhanuka Agritech has the highest 1-year return at 32.65%, while Best Agrolife has the lowest at -36.14%. Heranba Inds has a 1-year return of 1.24%, which is higher than Best Agrolife but significantly lower than Dhanuka Agritech. Additionally, the six-month returns are negative for Heranba Inds, Shivalik Rasayan, Best Agrolife, and Aristo Bio-Tech.

View full answer

Who are in the management team of Heranba Inds?

16-Jul-2025

As of March 2022, the management team of Heranba Inds includes Chairman Sadashiv Kanyana Shetty, Managing Director Raghuram Shetty, and several Executive Directors, along with a group of Independent Non-Executive Directors. This diverse team oversees the company's governance and operations.

As of March 2022, the management team of Heranba Inds includes the following individuals:<BR><BR>1. Sadashiv Kanyana Shetty - Chairman & Executive Director<BR>2. Raghuram Shetty - Executive Director & Managing Director<BR>3. Raunak R Shetty - Executive Director & Wholetime Director<BR>4. Shriraj Sadashiv Shetty - Executive Director & Wholetime Director<BR>5. Sujata Shetty - Executive Director & Wholetime Director<BR>6. Vanita Raghuram Shetty - Executive Director & Wholetime Director<BR>7. Mulky Vishwanath Shetty - Independent Non-Executive Director<BR>8. Anil Kumar M Marlecha - Independent Non-Executive Director<BR>9. Ganesh Vanmali - Independent Non-Executive Director<BR>10. Reshma D Wadkar - Independent Non-Executive Director<BR>11. Kaushik Hasmukh Gandhi - Independent Non-Executive Director<BR><BR>This team comprises both executive and independent directors, contributing to the governance and management of the company.

View full answer

Who are the top shareholders of the Heranba Inds?

17-Jul-2025

The top shareholders of Heranba Industries include promoter Raghuram Kanyan Shetty with 29.77%, public shareholder Meghdoot Thakkar with 1.21%, and individual investors holding 21.41%. Additionally, 7 foreign institutional investors hold a combined 0.1%, while no mutual funds have shares in the company.

The top shareholders of Heranba Industries include the promoters, who hold the majority of the shares. The promoter with the highest holding is Raghuram Kanyan Shetty, who owns 29.77% of the company. In terms of public shareholders, Meghdoot Thakkar holds 1.21%. Additionally, individual investors collectively hold 21.41% of the shares. There are also 7 foreign institutional investors (FIIs) with a combined holding of 0.1%, but no mutual funds currently hold shares in the company.

View full answer

How big is Heranba Inds?

24-Jul-2025

As of 24th July, Heranba Industries Ltd has a market capitalization of 1,460.00 Cr, with recent net sales of 1,409.73 Cr and a net profit of 3.06 Cr over the last four quarters.

As of 24th July, <BR><BR>Market Cap: Heranba Industries Ltd has a market capitalization of 1,460.00 Cr, categorizing it as a Small Cap company.<BR><BR>Recent Quarterly Performance: The sum of Net Sales for the latest 4 quarters is 1,409.73 Cr, while the sum of Net Profit for the same period is 3.06 Cr.<BR><BR>Balance Sheet Snapshot: The reporting period for the balance sheet is March 2024. Shareholder's Funds are valued at 843.06 Cr, and Total Assets amount to 1,460.95 Cr.

View full answer

How has been the historical performance of Heranba Inds?

17-Nov-2025

Heranba Inds has faced significant financial fluctuations over the past three years, with net sales increasing to 1,409.73 Cr in March 2025 but profits declining sharply, resulting in a profit after tax of only 2.25 Cr. Despite some growth in sales and total assets, the company has struggled with decreasing operating profits and earnings per share.

Answer:<BR>The historical performance of Heranba Inds shows significant fluctuations in key financial metrics over the past three years.<BR><BR>Breakdown:<BR>Heranba Inds reported net sales of 1,409.73 Cr in March 2025, an increase from 1,257.07 Cr in March 2024 but a decrease from 1,318.82 Cr in March 2023. The total operating income mirrored this trend, reaching 1,409.73 Cr in March 2025. However, total expenditure rose to 1,311.81 Cr in March 2025 from 1,180.20 Cr in March 2024, leading to an operating profit (PBDIT) of 105.50 Cr, which is an improvement from 90.70 Cr in March 2024 but a decline from 168.25 Cr in March 2023. Profit before tax also decreased significantly to 18.06 Cr in March 2025 from 52.24 Cr in March 2024 and 137.58 Cr in March 2023, resulting in a profit after tax of only 2.25 Cr in March 2025, down from 34.50 Cr in March 2024 and 104.37 Cr in March 2023. The earnings per share (EPS) reflected this decline, dropping to 0.77 in March 2025 from 8.72 in March 2024 and 26.09 in March 2023. On the balance sheet, total liabilities increased to 1,791.06 Cr in March 2025 from 1,461.11 Cr in March 2024, with total assets also rising to 1,791.06 Cr. Cash flow from operating activities decreased slightly to 101.00 Cr in March 2025 from 107.00 Cr in March 2024, while net cash inflow improved to 14.00 Cr in March 2025 from an outflow of 71.00 Cr in March 2024. Overall, Heranba Inds has experienced a challenging financial period with declining profits despite some growth in sales and total assets.

View full answer

Is Heranba Inds overvalued or undervalued?

19-Nov-2025

As of November 18, 2025, Heranba Industries is fairly valued with a PE ratio of -22.55, an EV to EBITDA of 19.62, and a Price to Book Value of 1.26, despite its year-to-date return of -35.52% lagging behind the Sensex's 8.36%, while peers like UPL and Dhanuka Agritech are valued at 26.93 and 18.98 respectively.

As of 18 November 2025, the valuation grade for Heranba Industries has moved from expensive to fair. The company is currently fairly valued based on its financial metrics. Key ratios include a PE ratio of -22.55, an EV to EBITDA of 19.62, and a Price to Book Value of 1.26. <BR><BR>When comparing Heranba to its peers, UPL stands out with an attractive PE ratio of 26.93, while Dhanuka Agritech is also fairly valued with a PE of 18.98. Notably, Heranba's recent stock performance has lagged significantly behind the Sensex, with a year-to-date return of -35.52% compared to the Sensex's 8.36%, reinforcing the notion that the stock may be undervalued relative to its current valuation grade.

View full answer

Is Heranba Inds technically bullish or bearish?

26-Nov-2025

As of November 25, 2025, Heranba Inds shows a bearish trend with strong weakness indicated by bearish MACD, Bollinger Bands, and moving averages, despite a mildly bullish OBV on the monthly chart.

As of 25 November 2025, the technical trend has changed from mildly bearish to bearish. The current stance for Heranba Inds is bearish with a strong indication of weakness. Key indicators driving this assessment include a bearish MACD on the weekly chart, bearish Bollinger Bands on both weekly and monthly time frames, and bearish moving averages on the daily chart. The KST is also bearish across both weekly and monthly periods. While the OBV shows a mildly bullish signal on the monthly, the overall technical picture remains negative, particularly highlighted by the significant declines in stock performance compared to the Sensex over various time frames.

View full answer

When is the next results date for Heranba Industries Ltd?

05-Feb-2026

The next results date for Heranba Industries Ltd is 11 February 2026.

The next results date for Heranba Industries Ltd is scheduled for 11 February 2026.

View full answer

Are Heranba Industries Ltd latest results good or bad?

12-Feb-2026

Heranba Industries Ltd's latest Q3 FY26 results are concerning, showing a net profit loss of ₹23.25 crore and a 42.23% decline in net sales, marking the third consecutive quarter of declining profitability and raising significant red flags for investors.

Heranba Industries Ltd's latest results for Q3 FY26 are concerning and indicate a significant decline in financial performance. The company reported a net profit loss of ₹23.25 crore, a drastic drop of 1503.45% compared to the previous quarter. This marks the third consecutive quarter of declining profitability, raising serious concerns about its operational stability.<BR><BR>Net sales also fell sharply by 42.23% quarter-on-quarter, totaling ₹301.37 crore, which is the lowest revenue recorded in the past twelve months. Year-on-year, sales decreased by 11.70%, suggesting that the company is losing market share and facing challenges in its core operations.<BR><BR>Operating margins have contracted to just 4.12%, down from 9.36% in the previous quarter, reflecting severe pricing pressures and operational inefficiencies. Additionally, the company's rising interest costs and increasing debt burden further complicate its financial situation.<BR><BR>Overall, the results indicate a troubling trend for Heranba Industries, characterized by declining revenues, mounting losses, and deteriorating margins, which are likely to raise red flags for investors.

View full answer

Should I buy, sell or hold Heranba Industries Ltd?

13-Feb-2026

Why is Heranba Industries Ltd falling/rising?

18-Mar-2026

As of 17-Mar, Heranba Industries Ltd's stock price is at 172.15, showing a minor increase but facing significant downward pressure with a year-to-date decline of 30.20% and weak fundamentals. Despite a slight uptick, the stock remains below key moving averages and close to its 52-week low, indicating ongoing bearish trends and lack of investor confidence.

As of 17-Mar, Heranba Industries Ltd's stock price is currently at 172.15, reflecting a slight increase of 0.1 (0.06%). Despite this minor rise, the stock has been experiencing significant downward pressure over various time frames. Over the past week, the stock has fallen by 7.92%, and in the last month, it has decreased by 18.39%. Year-to-date, the stock has declined by 30.20%, and over the past three years, it has dropped a staggering 43.39%. <BR><BR>The recent performance indicates a trend reversal, as the stock has gained after four consecutive days of decline. However, it remains below all key moving averages, including the 5-day, 20-day, 50-day, 100-day, and 200-day averages, which suggests a continued bearish trend. Additionally, the stock is close to its 52-week low, being only 3.22% away from the low of Rs 166.6.<BR><BR>Investor participation has also decreased, with delivery volume on 16 March falling by 51.24% compared to the 5-day average, indicating a lack of confidence among investors. The company's fundamentals are weak, highlighted by a -141.01% CAGR growth in operating profits over the last five years and negative results in the most recent quarter, where net sales fell by 26.9% compared to the previous four-quarter average. <BR><BR>Moreover, the stock has consistently underperformed against benchmarks, including a -17.63% return over the past year, while the BSE500 has shown positive growth. The absence of domestic mutual fund investment, which stands at 0%, further underscores the lack of confidence in the company's prospects. Overall, while there is a slight uptick in the stock price today, the broader context of declining performance and weak fundamentals suggests that the stock remains under significant pressure.

View full answer

Why is Heranba Industries Ltd falling/rising?

19-Mar-2026

As of 18-Mar, Heranba Industries Ltd's stock price is rising to 177.00, reflecting a 3.69% increase after a trend reversal. Despite today's gains and increased investor interest, the stock has seen significant declines over the year and three years, trading below its moving averages.

As of 18-Mar, Heranba Industries Ltd's stock price is rising, currently at 177.00, reflecting an increase of 6.3 points or 3.69%. This upward movement follows a trend reversal after five consecutive days of decline. The stock opened today with a significant gain of 4.75% and reached an intraday high of Rs 180.8, which is a 5.92% increase. Additionally, the stock has outperformed its sector by 2.06%, indicating positive momentum in today's trading session.<BR><BR>Investor participation has also increased, with delivery volume on 17 March rising by 113.3% compared to the five-day average, suggesting heightened interest in the stock. However, it is important to note that despite today's rise, Heranba Industries Ltd has experienced substantial declines over longer periods, including a year-to-date drop of 28.24% and a three-year decline of 41.80%. The stock is currently trading below its moving averages across various time frames, which may indicate underlying challenges despite the recent positive performance.

View full answer

Why is Heranba Industries Ltd falling/rising?

20-Mar-2026

As of 19-Mar, Heranba Industries Ltd's stock price is declining, currently at Rs 171.40, down 3.38%. The stock has significantly underperformed the Sensex, with a year-to-date decline of 30.51% compared to the index's 12.92%.

As of 19-Mar, Heranba Industries Ltd is experiencing a decline in its stock price, currently at Rs 171.40, which reflects a change of -6.0 (-3.38%). The stock has underperformed significantly compared to the benchmark Sensex, with a 1-week decline of -6.26% versus -2.40% for the index. Over the past month, the stock has dropped by -18.52%, while the Sensex has decreased by only -10.05%. Year-to-date, the stock is down -30.51%, compared to a -12.92% decline in the Sensex.<BR><BR>Today's trading session saw the stock open with a loss of -2.34% and reach an intraday low of Rs 170.2, marking a decrease of -4.06%. Additionally, the stock is trading below all key moving averages, including the 5-day, 20-day, 50-day, 100-day, and 200-day averages, indicating a bearish trend. The broader sector, Pesticides & Agrochemicals, has also fallen by -2.22%, contributing to the negative sentiment surrounding the stock.<BR><BR>Investor participation appears to be declining, with delivery volume on 18 March dropping by -54.95% compared to the 5-day average, suggesting reduced interest from investors. Furthermore, the stock is close to its 52-week low, being only 2.8% away from Rs 166.6. These factors collectively indicate that Heranba Industries Ltd is facing downward pressure on its stock price.

View full answer

Why is Heranba Industries Ltd falling/rising?

21-Mar-2026

As of 20-Mar, Heranba Industries Ltd's stock price is rising to Rs 179.20, up 4.83% today. However, the stock has a negative long-term outlook with a -21.40% return over the past year and significant declines in profits, indicating it may be a risky investment despite the recent gains.

As of 20-Mar, Heranba Industries Ltd's stock price is rising, currently at Rs 179.20, reflecting an increase of Rs 8.25 or 4.83%. This rise can be attributed to its performance today, where it outperformed the sector by 3.23% and reached an intraday high of Rs 186.95, marking a 9.36% increase. <BR><BR>However, it is important to note that the stock has faced significant challenges over the longer term. Over the past year, it has generated a return of -21.40%, and its profits have fallen by -235.9%. The company has shown weak long-term fundamental strength, with a -141.01% CAGR growth in operating profits over the last five years. Additionally, the stock has consistently underperformed against benchmarks, including the BSE500, in each of the last three annual periods.<BR><BR>Despite today's positive movement, the stock's overall performance indicates a risky investment, as evidenced by negative operating profits and a lack of domestic mutual fund investment, which suggests a lack of confidence in the company's future prospects. Thus, while the stock is currently rising, the broader context reveals significant underlying issues that could affect its sustainability.

View full answer

Why is Heranba Industries Ltd falling/rising?

24-Mar-2026

As of 23-Mar, Heranba Industries Ltd's stock price is at Rs 167.00, down 6.76%, with significant underperformance over various periods and weak financial results, including a 97.7% drop in profit. The long-term outlook is negative, marked by poor profitability and lack of investor confidence.

As of 23-Mar, Heranba Industries Ltd's stock price is falling, currently at Rs 167.00, which reflects a decrease of Rs 12.1 or 6.76%. The stock has underperformed significantly over various time periods, including a year-to-date decline of 32.29% compared to a 14.70% drop in the benchmark index. Over the past year, the stock has generated a return of -27.33%, while the broader market has only seen a decline of 5.47%.<BR><BR>Today's trading session has shown high volatility, with the stock opening 4.75% higher but quickly falling to an intraday low of Rs 167. This indicates a lack of sustained buying interest. The stock is also close to its 52-week low, just 0.24% away from Rs 166.6. Furthermore, the company has reported weak financial performance, including a significant drop in net sales and profits in the latest quarter, with net sales falling by 26.9% and profit after tax plummeting by 97.7% compared to previous quarters.<BR><BR>The long-term outlook appears bleak, with a -141.01% compound annual growth rate in operating profits over the last five years, and a low return on equity of 4.37%, suggesting poor profitability. Additionally, domestic mutual funds hold no stake in the company, which may reflect a lack of confidence in its future prospects. Overall, these factors contribute to the stock's decline, indicating that investors are reacting negatively to the company's financial health and market performance.

View full answer

Why is Heranba Industries Ltd falling/rising?

25-Mar-2026

As of 24-Mar, Heranba Industries Ltd's stock price is rising to Rs 174.55, reflecting a 3.01% increase today. However, this short-term gain contrasts with a 16.30% decline over the past month and a 29.23% drop year-to-date, indicating weak long-term fundamentals and declining investor confidence.

As of 24-Mar, Heranba Industries Ltd's stock price is rising, currently at Rs 174.55, reflecting a change of Rs 5.1 or 3.01% increase. This rise can be attributed to several factors observed in the stock's performance today. The stock opened with a gain of 2.1% and reached an intraday high of Rs 176.9, which is 4.4% higher than its previous close. Additionally, it outperformed its sector by 1.35%, indicating a relatively stronger performance compared to its peers.<BR><BR>However, it is important to note that despite this short-term rise, the stock has been underperforming over longer periods. For instance, in the last month, the stock has declined by 16.30%, and year-to-date, it has fallen by 29.23%. Furthermore, the stock is still close to its 52-week low, being only 4.8% away from Rs 166.6. <BR><BR>Investor participation appears to be declining, as evidenced by a 15.77% drop in delivery volume compared to the 5-day average. This suggests that while there may be a temporary uptick in price, the overall sentiment towards the stock remains cautious, especially given its weak long-term fundamentals and significant losses reported in recent quarters. <BR><BR>In summary, the current rise in Heranba Industries Ltd's stock price is primarily driven by a positive performance today, but it is juxtaposed against a backdrop of longer-term declines and weak investor confidence.

View full answer

Why is Heranba Industries Ltd falling/rising?

26-Mar-2026

As of 25-Mar, Heranba Industries Ltd's stock price is rising to Rs 178.50, up 2.26% in the short term, but it has seen significant long-term declines of 27.63% year-to-date and 71.63% over five years. The recent gains may be driven by short-term trading rather than sustained investor confidence, as indicated by declining delivery volumes.

As of 25-Mar, Heranba Industries Ltd's stock price is rising, currently at Rs 178.50, reflecting an increase of Rs 3.95 or 2.26%. This upward movement is supported by the stock gaining for the last two consecutive days, resulting in a total return of 5.34% during this period. Additionally, the stock opened today with a gain of 3.78% and reached an intraday high of Rs 185, which is a 5.99% increase.<BR><BR>Despite this positive short-term performance, it is important to note that the stock has experienced significant declines over longer periods, including a year-to-date drop of 27.63% and a 5-year decline of 71.63%. The current rise occurs in the context of a broader market where the Sensex has also been declining, with a 1-week performance of -1.87%.<BR><BR>Investor participation appears to be declining, as evidenced by a 37.75% drop in delivery volume compared to the 5-day average. However, the stock remains liquid enough for trading, suggesting that while there are challenges, the recent gains may be driven by short-term trading activity rather than sustained investor confidence. Overall, the stock's recent rise is notable but occurs against a backdrop of longer-term underperformance.

View full answer
iScoreScore
Click here to find our call on this stock
Strong Sell
Sell
Hold
Buy
Strong Buy

Dashboard

1

Weak Long Term Fundamental Strength with a -141.01% CAGR growth in Operating Profits over the last 5 years

  • The company has been able to generate a Return on Equity (avg) of 4.37% signifying low profitability per unit of shareholders funds
2

Negative results in Dec 25

3

Risky - Negative Operating Profits

4

Despite the size of the company, domestic mutual funds hold only 0% of the company

5

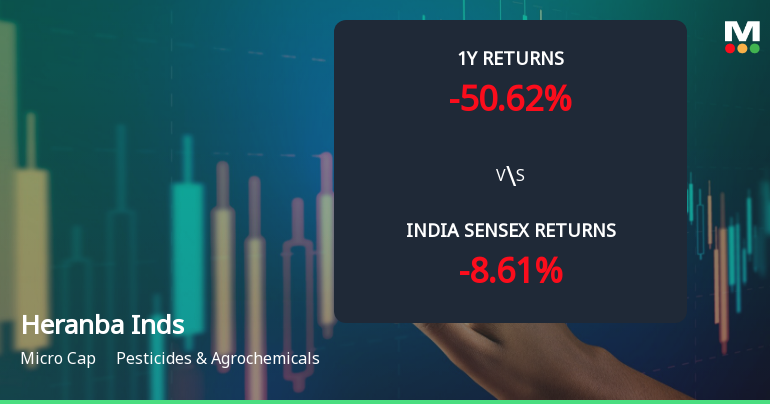
Consistent Underperformance against the benchmark over the last 3 years

stock-summaryMojo Parameters

Mojo Parameters

Loading Valuation Snapshot...

Stock DNA

stock-summary
Industry

Pesticides & Agrochemicals

stock-summary
Market cap

INR 737 Cr (Micro Cap)

stock-summary
P/E

NA (Loss Making)

stock-summary
Industry P/E

28

stock-summary
Dividend Yield

0.57%

stock-summary
Debt Equity

0.56

stock-summary
Return on Equity

-5.59%

stock-summary
Price to Book

0.83

Revenue and Profits:
Net Sales:
301 Cr
(Quarterly Results - Dec 2025)
Net Profit:
-23 Cr
stock-summaryTotal Returns
Total Returns (Price + Dividend) stock-summary
Dividend Yield (0.57%)
TimePeriod
Price Return
Dividend Return
Total Return
3 Months
-30.04%
0%
-30.04%
6 Months
-41.71%
0%
-41.71%
1 Year
-19.34%
0.45%
-18.89%
2 Years
-41.55%
0.66%
-40.89%
3 Years
-39.05%
1.04%
-38.01%
4 Years
-71.95%
0.87%
-71.08%
5 Years
-71.7%
0.91%
-70.79%

Latest dividend: 1 per share ex-dividend date: Sep-17-2025

Risk Adjusted Returns v/s stock-summary
Returns Beta
Icon
Beta has not been calculated since enough price history is not available
stock-summaryNews & Corporate Actions

News

Heranba Industries Ltd Gains 3.47%: 5 Key Factors Driving the Week’s Volatility

Announcements stock-summary

Icon
No announcement available

Corporate Actions stock-summary

stock-summary
BOARD MEETING

No Upcoming Board Meetings

stock-summary
DIVIDEND

Heranba Industries Ltd has declared 10% dividend, ex-date: 17 Sep 25

stock-summary
SPLITS

No Splits history available

stock-summary
BONUS

No Bonus history available

stock-summary
RIGHTS

No Rights history available

stock-summaryKey Factors

Quality key factors stock-summary

Factor
Value
Sales Growth (5y)
13.08%
EBIT Growth (5y)
-141.01%
EBIT to Interest (avg)
3.11
Debt to EBITDA (avg)
2.36
Net Debt to Equity (avg)
0.56
Sales to Capital Employed (avg)
1.21
Tax Ratio
38.13%
Dividend Payout Ratio
130.33%
Pledged Shares
0
Institutional Holding
0.35%
ROCE (avg)
7.85%
ROE (avg)
4.37%

Valuation key factors

Factor
Value
P/E Ratio
NA (Loss Making)
Industry P/E
28
Price to Book Value
0.85
EV to EBIT
-116.23
EV to EBITDA
15.21
EV to Capital Employed
0.90
EV to Sales
0.74
PEG Ratio
NA
Dividend Yield
0.56%
ROCE (Latest)
0.12%
ROE (Latest)
-5.59%

Technicals key factors

Indicator
Weekly
Monthly
MACD
Bearish
Bearish
RSI
No Signal
No Signal
Bollinger Bands
Bearish
Bearish
Moving Averages
Bearish (Daily)
KST
Bearish
Bearish
Dow Theory
Bearish
Bearish
OBV
No Trend
Mildly Bearish
stock-summary Technical Indicator Scale: Bearish, Mildly Bearish, Sideways, Mildly Bullish, Bullish  Turned 
stock-summaryShareholding
Shareholding Snapshot : Dec 2025stock-summary
Shareholding Compare (%holding) stock-summary
Majority shareholders

Promoters

Pledged Promoter Holdings

None

Mutual Funds

Held by 0 Schemes

FIIs

Held by 4 FIIs (0.08%)

Promoter with highest holding

Raghuram Kanyan Shetty (29.77%)

Highest Public shareholder

None

Individual Investors Holdings

21.1%

stock-summaryFinancial
[
  {
    "link": "quarterly",
    "btn_text": "All Quarterly Results",
    "header": "Quarterly Results Snapshot (Consolidated) - Dec'25 - QoQ",
    "rhs": [
      {
        "prefix": "Net Sales ",
        "suffix": "QoQ Growth in quarter ended Dec 2025 is -42.23% vs 15.31% in Sep 2025",
        "dir": -1
      },
      {
        "prefix": "Consolidated Net Profit ",
        "suffix": "QoQ Growth in quarter ended Dec 2025 is -1,503.45% vs -123.77% in Sep 2025",
        "dir": -1
      }
    ],
    "table": {
      "header": [
        "Dec'25",
        "Sep'25",
        "Change(%)"
      ],
      "body": [
        {
          "field": "Net Sales",
          "val1": "301.37",
          "val2": "521.71",
          "chgp": "-42.23%",
          "chgp_class": "negative"
        },
        {
          "field": "Operating Profit (PBDIT) excl Other Income",
          "val1": "12.43",
          "val2": "48.84",
          "chgp": "-74.55%",
          "chgp_class": "negative"
        },
        {
          "field": "Interest",
          "val1": "12.39",
          "val2": "12.33",
          "chgp": "0.49%",
          "chgp_class": "negative"
        },
        {
          "field": "Exceptional Items",
          "val1": "0.00",
          "val2": "0.00",
          "chgp": "",
          "chgp_class": "neutral"
        },
        {
          "field": "Consolidate Net Profit",
          "val1": "-23.25",
          "val2": "-1.45",
          "chgp": "-1,503.45%",
          "chgp_class": "negative"
        },
        {
          "field": "Operating Profit Margin (Excl OI)",
          "val1": "4.12%",
          "val2": "9.36%",
          "chgp": "-5.24%",
          "chgp_class": "negative"
        }
      ]
    }
  },
  {
    "link": "half-yearly",
    "btn_text": "All Half Yearly Results",
    "header": "Half Yearly Results Snapshot (Consolidated) - Sep'25",
    "rhs": [
      {
        "prefix": "Net Sales ",
        "suffix": " Growth in half year ended Sep 2025 is 32.78% vs 4.88% in Sep 2024",
        "dir": 1
      },
      {
        "prefix": "Consolidated Net Profit ",
        "suffix": " Growth in half year ended Sep 2025 is -91.51% vs 157.00% in Sep 2024",
        "dir": -1
      }
    ],
    "table": {
      "header": [
        "Sep'25",
        "Sep'24",
        "Change(%)"
      ],
      "body": [
        {
          "field": "Net Sales",
          "val1": "974.14",
          "val2": "733.67",
          "chgp": "32.78%",
          "chgp_class": "positive"
        },
        {
          "field": "Operating Profit (PBDIT) excl Other Income",
          "val1": "80.08",
          "val2": "99.86",
          "chgp": "-19.81%",
          "chgp_class": "negative"
        },
        {
          "field": "Interest",
          "val1": "23.88",
          "val2": "10.49",
          "chgp": "127.65%",
          "chgp_class": "negative"
        },
        {
          "field": "Exceptional Items",
          "val1": "0.00",
          "val2": "0.00",
          "chgp": "",
          "chgp_class": "neutral"
        },
        {
          "field": "Consolidate Net Profit",
          "val1": "4.65",
          "val2": "54.74",
          "chgp": "-91.51%",
          "chgp_class": "negative"
        },
        {
          "field": "Operating Profit Margin (Excl OI)",
          "val1": "8.22%",
          "val2": "13.61%",
          "chgp": "-5.39%",
          "chgp_class": "negative"
        }
      ]
    }
  },
  {
    "link": "nine-monthly",
    "btn_text": "All Nine Monthly Results",
    "header": "Nine Monthly Results Snapshot (Consolidated) - Dec'25",
    "rhs": [
      {
        "prefix": "Net Sales ",
        "suffix": "YoY Growth in nine months ended Dec 2025 is 18.66% vs 7.59% in Dec 2024",
        "dir": 1
      },
      {
        "prefix": "Consolidated Net Profit ",
        "suffix": "YoY Growth in nine months ended Dec 2025 is -141.75% vs 26.49% in Dec 2024",
        "dir": -1
      }
    ],
    "table": {
      "header": [
        "Dec'25",
        "Dec'24",
        "Change(%)"
      ],
      "body": [
        {
          "field": "Net Sales",
          "val1": "1,275.51",
          "val2": "1,074.96",
          "chgp": "18.66%",
          "chgp_class": "positive"
        },
        {
          "field": "Operating Profit (PBDIT) excl Other Income",
          "val1": "92.51",
          "val2": "112.39",
          "chgp": "-17.69%",
          "chgp_class": "negative"
        },
        {
          "field": "Interest",
          "val1": "36.27",
          "val2": "16.64",
          "chgp": "117.97%",
          "chgp_class": "negative"
        },
        {
          "field": "Exceptional Items",
          "val1": "0.00",
          "val2": "0.00",
          "chgp": "",
          "chgp_class": "neutral"
        },
        {
          "field": "Consolidate Net Profit",
          "val1": "-18.60",
          "val2": "44.55",
          "chgp": "-141.75%",
          "chgp_class": "negative"
        },
        {
          "field": "Operating Profit Margin (Excl OI)",
          "val1": "7.25%",
          "val2": "10.46%",
          "chgp": "-3.21%",
          "chgp_class": "negative"
        }
      ]
    }
  },
  {
    "link": "annual",
    "btn_text": "All Annual Results",
    "header": "Annual Results Snapshot (Consolidated) - Mar'25",
    "rhs": [
      {
        "prefix": "Net Sales ",
        "suffix": "YoY Growth in year ended Mar 2025 is 12.14% vs -4.68% in Mar 2024",
        "dir": 1
      },
      {
        "prefix": "Consolidated Net Profit ",
        "suffix": "YoY Growth in year ended Mar 2025 is -91.20% vs -66.57% in Mar 2024",
        "dir": -1
      }
    ],
    "table": {
      "header": [
        "Mar'25",
        "Mar'24",
        "Change(%)"
      ],
      "body": [
        {
          "field": "Net Sales",
          "val1": "1,409.73",
          "val2": "1,257.07",
          "chgp": "12.14%",
          "chgp_class": "positive"
        },
        {
          "field": "Operating Profit (PBDIT) excl Other Income",
          "val1": "97.92",
          "val2": "76.87",
          "chgp": "27.38%",
          "chgp_class": "positive"
        },
        {
          "field": "Interest",
          "val1": "30.83",
          "val2": "12.35",
          "chgp": "149.64%",
          "chgp_class": "negative"
        },
        {
          "field": "Exceptional Items",
          "val1": "0.00",
          "val2": "0.00",
          "chgp": "",
          "chgp_class": "neutral"
        },
        {
          "field": "Consolidate Net Profit",
          "val1": "3.07",
          "val2": "34.89",
          "chgp": "-91.20%",
          "chgp_class": "negative"
        },
        {
          "field": "Operating Profit Margin (Excl OI)",
          "val1": "6.95%",
          "val2": "6.12%",
          "chgp": "0.83%",
          "chgp_class": "positive"
        }
      ]
    }
  }
]

Quarterly Results Snapshot (Consolidated) - Dec'25 - QoQstock-summary

Dec'25
Sep'25
Change(%)
Net Sales
301.37
521.71
-42.23%
Operating Profit (PBDIT) excl Other Income
12.43
48.84
-74.55%
Interest
12.39
12.33
0.49%
Exceptional Items
0.00
0.00
Consolidate Net Profit
-23.25
-1.45
-1,503.45%
Operating Profit Margin (Excl OI)
4.12%
9.36%
-5.24%
Values in Rs Cr.
Direction Arrows
Net Sales

QoQ Growth in quarter ended Dec 2025 is -42.23% vs 15.31% in Sep 2025

Direction Arrows
Consolidated Net Profit

QoQ Growth in quarter ended Dec 2025 is -1,503.45% vs -123.77% in Sep 2025

Half Yearly Results Snapshot (Consolidated) - Sep'25stock-summary

Sep'25
Sep'24
Change(%)
Net Sales
974.14
733.67
32.78%
Operating Profit (PBDIT) excl Other Income
80.08
99.86
-19.81%
Interest
23.88
10.49
127.65%
Exceptional Items
0.00
0.00
Consolidate Net Profit
4.65
54.74
-91.51%
Operating Profit Margin (Excl OI)
8.22%
13.61%
-5.39%
Values in Rs Cr.
Direction Arrows
Net Sales

Growth in half year ended Sep 2025 is 32.78% vs 4.88% in Sep 2024

Direction Arrows
Consolidated Net Profit

Growth in half year ended Sep 2025 is -91.51% vs 157.00% in Sep 2024

Nine Monthly Results Snapshot (Consolidated) - Dec'25stock-summary

Dec'25
Dec'24
Change(%)
Net Sales
1,275.51
1,074.96
18.66%
Operating Profit (PBDIT) excl Other Income
92.51
112.39
-17.69%
Interest
36.27
16.64
117.97%
Exceptional Items
0.00
0.00
Consolidate Net Profit
-18.60
44.55
-141.75%
Operating Profit Margin (Excl OI)
7.25%
10.46%
-3.21%
Values in Rs Cr.
Direction Arrows
Net Sales

YoY Growth in nine months ended Dec 2025 is 18.66% vs 7.59% in Dec 2024

Direction Arrows
Consolidated Net Profit

YoY Growth in nine months ended Dec 2025 is -141.75% vs 26.49% in Dec 2024

Annual Results Snapshot (Consolidated) - Mar'25stock-summary

Mar'25
Mar'24
Change(%)
Net Sales
1,409.73
1,257.07
12.14%
Operating Profit (PBDIT) excl Other Income
97.92
76.87
27.38%
Interest
30.83
12.35
149.64%
Exceptional Items
0.00
0.00
Consolidate Net Profit
3.07
34.89
-91.20%
Operating Profit Margin (Excl OI)
6.95%
6.12%
0.83%
Values in Rs Cr.
Direction Arrows
Net Sales

YoY Growth in year ended Mar 2025 is 12.14% vs -4.68% in Mar 2024

Direction Arrows
Consolidated Net Profit

YoY Growth in year ended Mar 2025 is -91.20% vs -66.57% in Mar 2024

stock-summaryCompany CV
About Heranba Industries Ltd stock-summary
stock-summary
Heranba Industries Ltd
Micro Cap
Pesticides & Agrochemicals
Incorporated in 1992, Heranba Industries Limited is engaged in manufacturing and sale of agro chemical products. The Company produces synthetic Phrethroids and its intermediates. Presently, the Company provides processing services for Ammonolysis, Esterification, Hydrolysis, Condensation, Favorski Reaction, Isomerisation, Cyanation, Friedel Crafts, Methoxylation, Cyclisation, Halogenation, Sulphonation etc.
Company Coordinates stock-summary
Company Details
Plot No 1504/1505/1506/1, GIDC Phase-III Vapi Valsad Gujarat : 396195
stock-summary
Tel: 91-260-2401646
stock-summary
compliance@heranba.com
Registrar Details