
Compare Heranba Inds with Similar Stocks
Dashboard
With a Operating Losses, the company has a Weak Long Term Fundamental Strength
- The company has been able to generate a Return on Equity (avg) of 1.50% signifying low profitability per unit of shareholders funds
The company has declared negative results for the last 2 consecutive quarters
Risky - Negative Operating Profits
Despite the size of the company, domestic mutual funds hold only 0% of the company
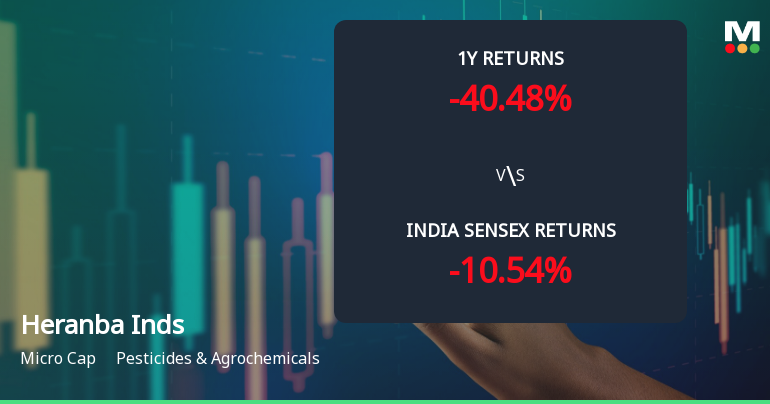
Consistent Underperformance against the benchmark over the last 3 years
Stock DNA
Pesticides & Agrochemicals
INR 737 Cr (Micro Cap)
NA (Loss Making)
28
0.53%
0.71
-10.03%
0.99
Total Returns (Price + Dividend) 
Latest dividend: 1 per share ex-dividend date: Sep-17-2025
Risk Adjusted Returns v/s
Returns Beta

News
Heranba Industries Ltd Faces Technical Setbacks Amid Prolonged Downtrend
Heranba Industries Ltd, a micro-cap player in the pesticides and agrochemicals sector, has experienced a notable shift in its technical momentum, reflecting a complex interplay of bearish and mildly bullish signals. Despite a recent downgrade to a Strong Sell rating with a Mojo Score of 6.0, the stock’s technical indicators reveal nuanced trends that merit close attention from investors navigating a challenging market environment.
Read full news article
Heranba Industries Ltd is Rated Strong Sell
Heranba Industries Ltd is rated Strong Sell by MarketsMOJO, with this rating last updated on 27 Oct 2025. However, the analysis and financial metrics discussed here reflect the stock’s current position as of 04 June 2026, providing investors with an up-to-date view of the company’s fundamentals, valuation, financial trends, and technical outlook.
Read full news article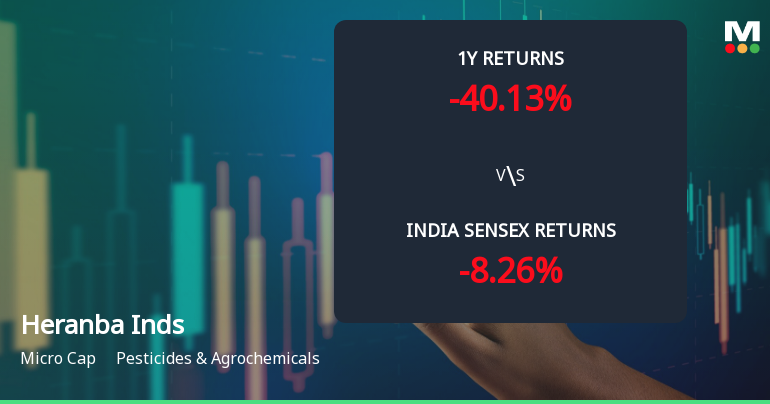
Heranba Industries Ltd Technical Momentum Shifts Amid Bearish Market Sentiment
Heranba Industries Ltd, a micro-cap player in the Pesticides & Agrochemicals sector, has experienced a subtle shift in its technical momentum, moving from a bearish to a mildly bearish trend. Despite a modest day gain of 0.68%, the stock remains under pressure with mixed signals from key technical indicators such as MACD, RSI, and moving averages, reflecting ongoing investor caution amid a challenging market backdrop.
Read full news article Announcements
Announcement under Regulation 30 (LODR)-Newspaper Publication
30-May-2026 | Source : BSEEnclosed herewith Newspaper Publication of Financial Results for the quarter and year ended March 31 2026.
Announcement under Regulation 30 (LODR)-Change in Management
28-May-2026 | Source : BSEEnclosed herewith disclosure for Change in Management.
Board Meeting Outcome for Board Meeting Held Today I.E. On May 28 2026.
28-May-2026 | Source : BSEEnclosed herewith Outcome of Board Meeting.
Corporate Actions

No Upcoming Board Meetings

Heranba Industries Ltd has declared 10% dividend, ex-date: 17 Sep 25

No Splits history available

No Bonus history available

No Rights history available
Quality key factors
Valuation key factors
Technicals key factors
 Technical Indicator Scale: Bearish, Mildly Bearish, Sideways, Mildly Bullish, Bullish Turned
 Shareholding Snapshot : Mar 2026
Shareholding Compare (%holding)
Promoters
None
Held by 0 Schemes
Held by 4 FIIs (0.07%)
Raghuram Kanyan Shetty (29.77%)
None
20.66%
Quarterly Results Snapshot (Consolidated) - Mar'26 - QoQ

QoQ Growth in quarter ended Mar 2026 is 6.01% vs -42.23% in Dec 2025
QoQ Growth in quarter ended Mar 2026 is -148.69% vs -1,503.45% in Dec 2025
Half Yearly Results Snapshot (Consolidated) - Sep'25
Growth in half year ended Sep 2025 is 32.78% vs 4.88% in Sep 2024

Growth in half year ended Sep 2025 is -91.51% vs 157.00% in Sep 2024
Nine Monthly Results Snapshot (Consolidated) - Dec'25
YoY Growth in nine months ended Dec 2025 is 18.66% vs 7.59% in Dec 2024
YoY Growth in nine months ended Dec 2025 is -141.75% vs 26.49% in Dec 2024
Annual Results Snapshot (Consolidated) - Mar'26
YoY Growth in year ended Mar 2026 is 13.14% vs 12.14% in Mar 2025
YoY Growth in year ended Mar 2026 is -2,589.25% vs -91.20% in Mar 2025
About Heranba Industries Ltd

Company Coordinates


