
Compare Hester Bios with Similar Stocks
Dashboard
Low ability to service debt as the company has a high Debt to EBITDA ratio of 2.25 times
- Poor long term growth as Net Sales has grown by an annual rate of 9.19% and Operating profit at 4.14% over the last 5 years
- Low ability to service debt as the company has a high Debt to EBITDA ratio of 2.25 times
- The company has been able to generate a Return on Capital Employed (avg) of 8.56% signifying low profitability per unit of total capital (equity and debt)
Poor long term growth as Net Sales has grown by an annual rate of 9.19% and Operating profit at 4.14% over the last 5 years
The company has declared Positive results for the last 8 consecutive quarters
With ROCE of 12.4, it has a Very Expensive valuation with a 3.5 Enterprise value to Capital Employed
Stock DNA
Pharmaceuticals & Biotechnology
INR 1,780 Cr (Micro Cap)
33.00
34
0.34%
0.52
14.91%
4.84
Total Returns (Price + Dividend) 
Latest dividend: 7 per share ex-dividend date: Aug-06-2025
Risk Adjusted Returns v/s
Returns Beta

News

Hester Biosciences Ltd is Rated Hold by MarketsMOJO
Hester Biosciences Ltd is rated 'Hold' by MarketsMOJO, with this rating last updated on 08 June 2026. However, the analysis and financial metrics discussed here reflect the stock’s current position as of 20 June 2026, providing investors with an up-to-date view of the company’s fundamentals, returns, and market performance.
Read full news article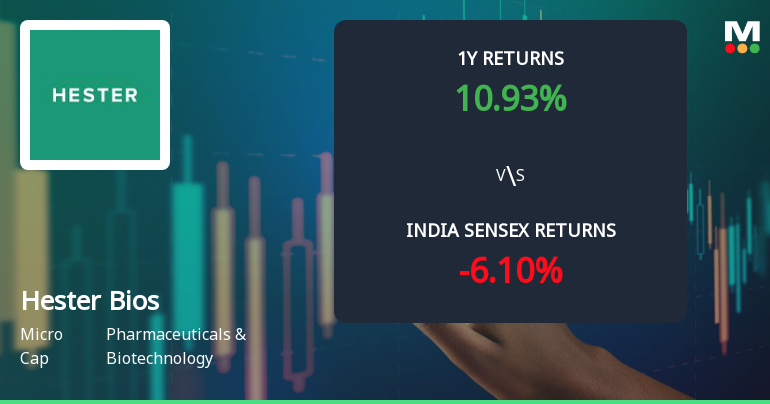
Hester Biosciences Ltd Technical Momentum Shifts Signal Bullish Outlook
Hester Biosciences Ltd has exhibited a notable shift in its technical momentum, moving from a mildly bullish to a bullish stance across key indicators. Despite a slight dip in the daily price, the stock’s weekly and monthly technical parameters suggest strengthening momentum, positioning it favourably within the Pharmaceuticals & Biotechnology sector.
Read full news article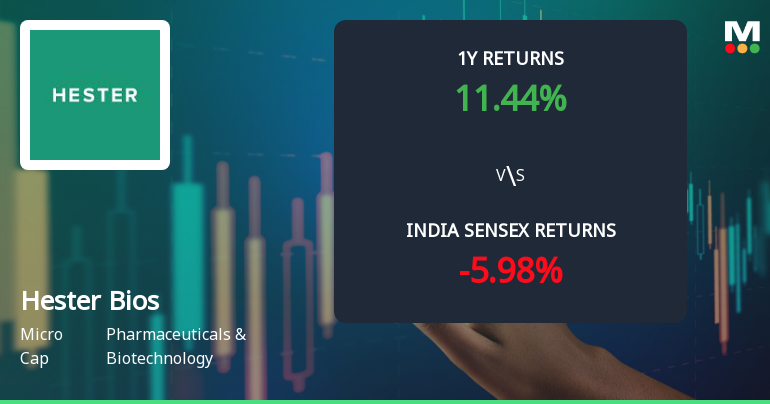
Hester Biosciences Ltd Sees Technical Momentum Shift Amid Strong Price Gains
Hester Biosciences Ltd, a micro-cap player in the Pharmaceuticals & Biotechnology sector, has witnessed a notable shift in its technical momentum, reflected in a 5.57% surge in its share price to ₹2,069.50 on 16 Jun 2026. This price movement accompanies a technical rating upgrade from Sell to Hold, signalling a cautiously optimistic outlook amid mixed indicator signals across weekly and monthly timeframes.
Read full news article Announcements
Hester Biosciences Limited - Outcome of Board Meeting
06-Nov-2019 | Source : NSEHester Biosciences Limited has informed the Exchange regarding Board meeting held on November 06, 2019.
Hester Biosciences Limited - Analysts/Institutional Investor Meet/Con. Call Updates
31-Oct-2019 | Source : NSEHester Biosciences Limited has informed the Exchange regarding Analysts/Institutional Investor Meet/Con. Call Updates
Shareholders meeting
05-Aug-2019 | Source : NSE
| There is Discrepancies in earlier filed Voting Results. So we have rectified the error and uploaded revised file. |
Corporate Actions

No Upcoming Board Meetings

Hester Biosciences Ltd has declared 70% dividend, ex-date: 06 Aug 25

No Splits history available

Hester Biosciences Ltd has announced 1:2 bonus issue, ex-date: 27 Sep 12

Hester Biosciences Ltd has announced 2:5 rights issue, ex-date: 29 May 06
Quality key factors
Valuation key factors
Technicals key factors
 Technical Indicator Scale: Bearish, Mildly Bearish, Sideways, Mildly Bullish, Bullish Turned
 Shareholding Snapshot : Mar 2026
Shareholding Compare (%holding)
Promoters
None
Held by 2 Schemes (0.0%)
Held by 15 FIIs (0.38%)
Rajiv Dinesh Gandhi (10.48%)
Kuntal Hasmukhlal Shah (3.17%)
33.29%
Quarterly Results Snapshot (Consolidated) - Mar'26 - YoY

YoY Growth in quarter ended Mar 2026 is 22.19% vs 3.37% in Mar 2025
YoY Growth in quarter ended Mar 2026 is 1,138.76% vs -73.94% in Mar 2025
Half Yearly Results Snapshot (Consolidated) - Sep'25

Growth in half year ended Sep 2025 is -6.56% vs 4.83% in Sep 2024
Growth in half year ended Sep 2025 is 112.45% vs 45.98% in Sep 2024
Nine Monthly Results Snapshot (Consolidated) - Dec'25
YoY Growth in nine months ended Dec 2025 is 1.44% vs 1.73% in Dec 2024
YoY Growth in nine months ended Dec 2025 is 51.37% vs 87.95% in Dec 2024
Annual Results Snapshot (Consolidated) - Mar'26
YoY Growth in year ended Mar 2026 is 6.91% vs 2.15% in Mar 2025
YoY Growth in year ended Mar 2026 is 102.40% vs 45.53% in Mar 2025
About Hester Biosciences Ltd

Company Coordinates


