
Compare Heubach Colorant with Similar Stocks
Dashboard
Flat results in Sep 25
- PBT LESS OI(Q) At Rs 12.13 cr has Fallen at -32.6% (vs previous 4Q average)
- NET SALES(Q) At Rs 183.14 cr has Fallen at -15.1% (vs previous 4Q average)
- DPS(Y) Lowest at Rs 0.00
Despite the size of the company, domestic mutual funds hold only 0% of the company
Below par performance in long term as well as near term
Stock DNA
Dyes And Pigments
INR 997 Cr (Micro Cap)
14.00
32
0.00%
-0.33
12.40%
1.81
Total Returns (Price + Dividend) 
Latest dividend: 15 per share ex-dividend date: Aug-04-2021
Risk Adjusted Returns v/s
Returns Beta

News
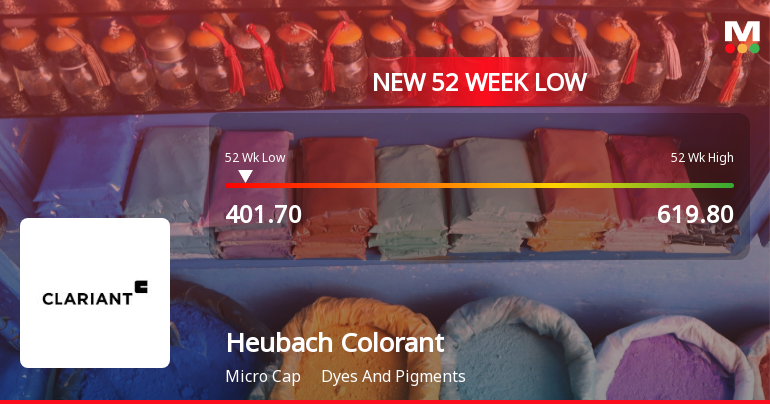
Heubach Colorants India Ltd Falls to 52-Week Low of Rs.418
Heubach Colorants India Ltd’s stock declined sharply to a fresh 52-week low of Rs.418 on 19 Jan 2026, marking a significant milestone in its ongoing downward trajectory. The stock has underperformed its sector and broader market indices, reflecting a series of financial setbacks and subdued market sentiment.
Read full news article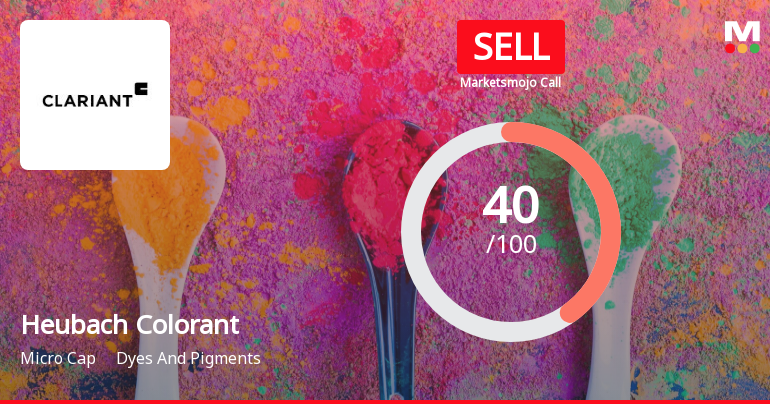
Heubach Colorants India Ltd is Rated Sell
Heubach Colorants India Ltd is rated 'Sell' by MarketsMOJO, with this rating last updated on 01 Nov 2025. However, the analysis and financial metrics discussed here reflect the stock's current position as of 12 January 2026, providing investors with the latest insights into the company’s performance and outlook.
Read full news article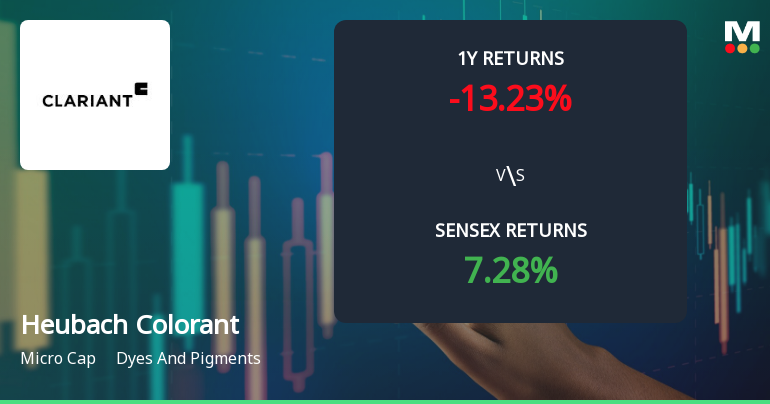
Heubach Colorants India Ltd Sees Mixed Technical Signals Amid Price Momentum Shift
Heubach Colorants India Ltd, a key player in the dyes and pigments sector, has experienced a subtle shift in its technical momentum, moving from a bearish to a mildly bearish stance. Despite a modest day gain of 0.55%, the stock’s technical indicators present a complex picture, with some signals suggesting caution while others hint at potential resilience. This analysis delves into the recent technical developments, price momentum, and comparative performance against the broader market benchmarks.
Read full news article Announcements
Clariant Chemicals (India) Limited - Updates
09-Dec-2019 | Source : NSEClariant Chemicals (India) Limited has informed the Exchange regarding 'Intimation under Regulation 30 of SEBI (Listing Obligations and Disclosure Requirements) Regulations, 2015'.
Clariant Chemicals (India) Limited - Updates
18-Oct-2019 | Source : NSEClariant Chemicals (India) Limited has informed the Exchange regarding 'Certificate pursuant to Regulation 74(5) of SEBI (Depositories and Participants) Regulations, 2018Certificate pursuant to Regulation 74(5) of SEBI (Depositories and Participants) Regulations, 2018'.
Updates
06-Sep-2019 | Source : NSE
| Clariant Chemicals (India) Limited has informed the Exchange regarding 'The Minutes of 62nd Annual General Meeting of the Company held on August 8, 2019, as circulated and signed by the Chairman, is enclosed herewith.'. |
Corporate Actions

No Upcoming Board Meetings

Heubach Colorants India Ltd has declared 150% dividend, ex-date: 04 Aug 21

No Splits history available

No Bonus history available

No Rights history available
Quality key factors
Valuation key factors
Technicals key factors
 Technical Indicator Scale: Bearish, Mildly Bearish, Sideways, Mildly Bullish, Bullish Turned
 Shareholding Snapshot : Sep 2025
Shareholding Compare (%holding)
Promoters
None
Held by 2 Schemes (0.0%)
Held by 24 FIIs (1.28%)
Colorants International Ag (36.56%)
Rajasthan Global Securities Private Limited (8.21%)
25.32%
Quarterly Results Snapshot (Standalone) - Sep'25 - QoQ

QoQ Growth in quarter ended Sep 2025 is -13.09% vs -4.34% in Jun 2025
QoQ Growth in quarter ended Sep 2025 is -4.74% vs 60.62% in Jun 2025
Half Yearly Results Snapshot (Standalone) - Sep'25

Growth in half year ended Sep 2025 is 0.53% vs -4.37% in Sep 2024
Growth in half year ended Sep 2025 is 41.43% vs -18.38% in Sep 2024
Nine Monthly Results Snapshot (Standalone) - Dec'24
YoY Growth in nine months ended Dec 2024 is 3.24% vs -0.17% in Dec 2023
YoY Growth in nine months ended Dec 2024 is 15.65% vs 255.29% in Dec 2023
Annual Results Snapshot (Standalone) - Mar'25
YoY Growth in year ended Mar 2025 is 4.35% vs 3.17% in Mar 2024
YoY Growth in year ended Mar 2025 is 25.06% vs 114.49% in Mar 2024
About Heubach Colorants India Ltd

Company Coordinates


