
Compare Hilltone Softwar with Similar Stocks
Dashboard
With a Operating Losses, the company has a Weak Long Term Fundamental Strength
- Poor long term growth as Operating profit has grown by an annual rate -14.73% of over the last 5 years
- Company's ability to service its debt is weak with a poor EBIT to Interest (avg) ratio of -0.30
Risky - Negative Operating Profits
Below par performance in long term as well as near term
Stock DNA
Other Chemical products
INR 60 Cr (Micro Cap)
NA (Loss Making)
NA
0.00%
-0.07
-0.30%
2.63
Total Returns (Price + Dividend) 
Hilltone Softwar for the last several years.
Risk Adjusted Returns v/s
Returns Beta

News
Are Hilltone Software & Gases Ltd latest results good or bad?
Hilltone Software & Gases Ltd has reported financial results for Q4 FY26 that highlight significant operational challenges. The company recorded net sales of ₹2.31 crores, reflecting a substantial decline of 65.21% compared to the previous quarter's revenue of ₹6.64 crores. This volatility raises concerns about the company's ability to maintain stable revenue streams, which is critical for investor confidence. In terms of profitability, Hilltone reported a net loss of ₹0.27 crores, contrasting sharply with a profit of ₹0.99 crores in the preceding quarter. The operating margin stood at -10.82%, indicating persistent negative profitability. This marks a continuation of negative operating margins in six of the last seven quarters, suggesting deeper structural issues within the company's cost management and pricing strategies. The return on equity (ROE) for the latest quarter was -1.83%, underscoring signifi...
Read full news article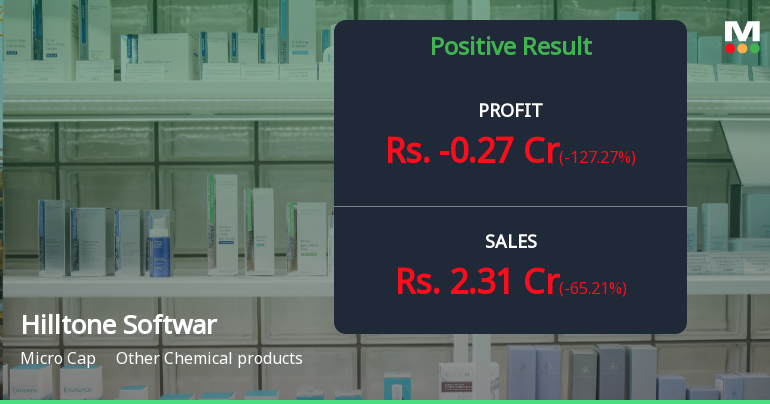
Hilltone Software & Gases Q4 FY26: Losses Deepen Amid Revenue Volatility
Hilltone Software & Gases Ltd., a micro-cap industrial and medical oxygen gases producer with a market capitalisation of ₹66.00 crores, reported a challenging Q4 FY26 performance with net losses deepening to ₹0.27 crores despite modest year-on-year revenue growth. The quarter-on-quarter revenue collapse of 65.21% and persistent negative operating margins underscore the operational difficulties facing the company, which has struggled to achieve consistent profitability since its 1993 inception.
Read full news article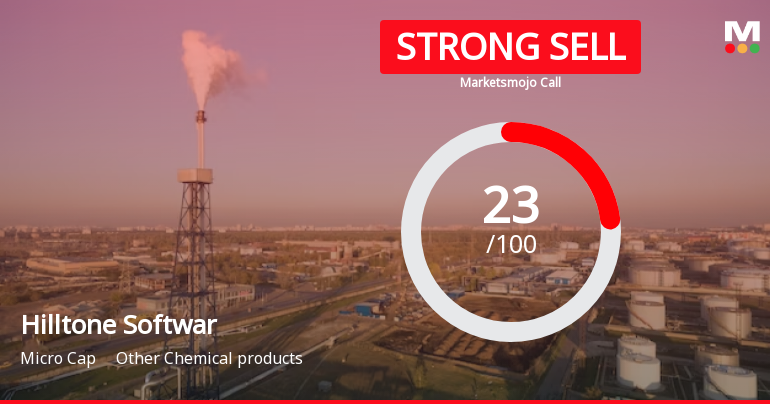
Hilltone Software & Gases Ltd is Rated Strong Sell
Hilltone Software & Gases Ltd is rated Strong Sell by MarketsMOJO, with this rating last updated on 23 Mar 2026. However, the analysis and financial metrics discussed here reflect the stock’s current position as of 29 May 2026, providing investors with an up-to-date view of the company’s fundamentals, valuation, financial trends, and technical outlook.
Read full news article Announcements
Intimation Under Regulation 7(2) Of The Securities And Exchange Board Of India (Prohibition Of Insider Trading) Regulations 2015
04-Jun-2026 | Source : BSEIntimation under Regulation 7(2) of SEBI (PIT) Regulations 2015
Statement Of Variation And Deviation
30-May-2026 | Source : BSEStatement of Variation and Deviation for Quarter ending on 31st March 2026
Board Meeting Outcome for OUTCOME OF BOARD MEETING HELD ON 30Th MAY 2025
30-May-2026 | Source : BSETHE BOARD APPROVED FINANCIAL RESULTS FOR QUARTER AND YEAR ENDING ON 31st MARCH 2026
Corporate Actions

No Upcoming Board Meetings

No Dividend history available

No Splits history available

No Bonus history available

No Rights history available
Quality key factors
Valuation key factors
Technicals key factors
 Technical Indicator Scale: Bearish, Mildly Bearish, Sideways, Mildly Bullish, Bullish Turned
 Shareholding Snapshot : Mar 2026
Shareholding Compare (%holding)
Non Institution
None
Held by 0 Schemes
Held by 2 FIIs (4.18%)
Hitalbhai Mahendrabhai Shah (5.09%)
Parminder Singh Sethi (6.02%)
49.4%
Quarterly Results Snapshot (Standalone) - Mar'26 - QoQ

QoQ Growth in quarter ended Mar 2026 is -65.21% vs 92.46% in Dec 2025
QoQ Growth in quarter ended Mar 2026 is -127.27% vs 262.30% in Dec 2025
Half Yearly Results Snapshot (Standalone) - Sep'25
Not Applicable: The company has declared_date for only one period
Not Applicable: The company has declared_date for only one period
Nine Monthly Results Snapshot (Standalone) - Dec'25

YoY Growth in nine months ended Dec 2025 is 128.49% vs 9.02% in Dec 2024
YoY Growth in nine months ended Dec 2025 is -67.74% vs -53.03% in Dec 2024
Annual Results Snapshot (Standalone) - Mar'26
YoY Growth in year ended Mar 2026 is 95.88% vs 9.78% in Mar 2025
YoY Growth in year ended Mar 2026 is 193.75% vs -131.37% in Mar 2025
About Hilltone Software & Gases Ltd

Company Coordinates


