
Compare Hind. Unilever with Similar Stocks
Dashboard
Flat results in Mar 26
- ROCE(HY) Lowest at 20.15%
- INVENTORY TURNOVER RATIO(HY) Lowest at 13.47 times
- CASH AND CASH EQUIVALENTS(HY) Lowest at Rs 3,248.00 cr
With ROE of 24.7, it has a Expensive valuation with a 10.4 Price to Book Value
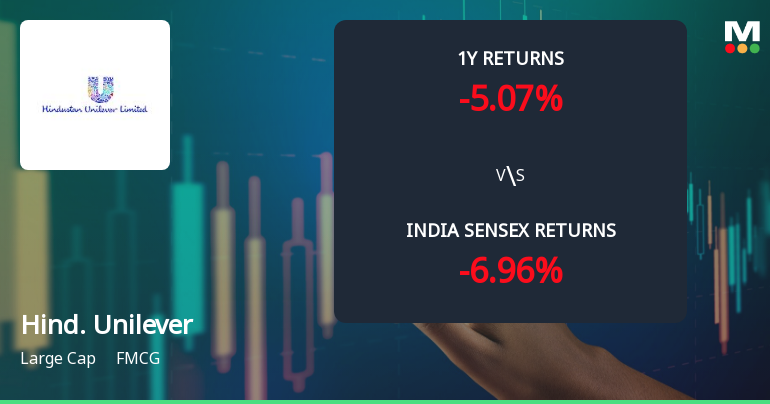
Consistent Underperformance against the benchmark over the last 3 years
Stock DNA
FMCG
INR 503,741 Cr (Large Cap)
42.00
46
3.00%
-0.12
24.69%
10.43
Total Returns (Price + Dividend) 
Latest dividend: 21.95172095172095 per share ex-dividend date: Jun-23-2026
Risk Adjusted Returns v/s
Returns Beta

News
Hindustan Unilever Ltd Technical Momentum Shifts Amid Market Pressure
Hindustan Unilever Ltd (HUL), a stalwart in the FMCG sector, has experienced a notable shift in its technical momentum, reflecting a complex interplay of bullish and bearish signals across key indicators. The stock’s recent downgrade from Hold to Sell by MarketsMOJO, accompanied by a Mojo Score of 46.0, underscores growing caution among analysts as price momentum shows signs of weakening amid broader market pressures.
Read full news article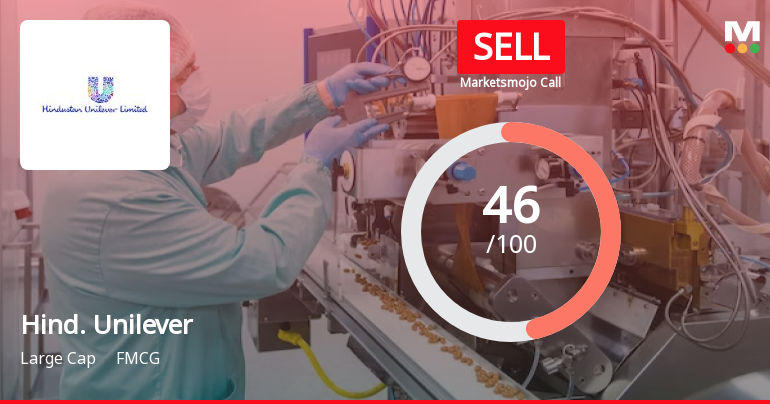
Hindustan Unilever Ltd Downgraded to Sell Amid Technical Weakness and Valuation Concerns
Hindustan Unilever Ltd (HUL), a dominant player in the FMCG sector, has seen its investment rating downgraded from Hold to Sell as of 22 June 2026. This shift reflects a combination of deteriorating technical indicators, flat financial performance, and valuation pressures despite the company’s strong long-term fundamentals and market leadership.
Read full news article
Hindustan Unilever Ltd Technical Momentum Shifts Amid Bearish Signals
Hindustan Unilever Ltd (HUL), a stalwart in the FMCG sector, has recently experienced a shift in its technical momentum, moving from a mildly bearish to a more pronounced bearish trend. Despite some mildly bullish signals on weekly indicators, the overall technical landscape suggests caution for investors as key metrics such as MACD, moving averages, and Bollinger Bands point towards weakening price momentum.
Read full news article Announcements
Performance Highlights For The Financial Year 2025-26
17-Jun-2026 | Source : BSEPerformance Highlights for the financial year 2025-26
Closure of Trading Window
12-Jun-2026 | Source : BSEIntimation for Trading Window Closure for the quarter ending 30th June 2026
Announcement under Regulation 30 (LODR)-Newspaper Publication
11-Jun-2026 | Source : BSESubmission of Notice to Equity Shareholders regarding the Demat Drive organised by the Company
Corporate Actions

No Upcoming Board Meetings

Hindustan Unilever Ltd has declared 2200% dividend, ex-date: 23 Jun 26

No Splits history available

No Bonus history available

No Rights history available
Quality key factors
Valuation key factors
Technicals key factors
 Technical Indicator Scale: Bearish, Mildly Bearish, Sideways, Mildly Bullish, Bullish Turned
 Shareholding Snapshot : Mar 2026
Shareholding Compare (%holding)
Promoters
None
Held by 52 Schemes (6.62%)
Held by 975 FIIs (10.1%)
Unilever Plc (47.43%)
Lici New Pension Plus Growth Fund (6.92%)
9.93%
Quarterly Results Snapshot (Consolidated) - Mar'26 - QoQ

QoQ Growth in quarter ended Mar 2026 is -0.55% vs 3.28% in Dec 2025
QoQ Growth in quarter ended Mar 2026 is -54.71% vs 146.07% in Dec 2025
Half Yearly Results Snapshot (Consolidated) - Sep'25

Growth in half year ended Sep 2025 is 3.55% vs 1.65% in Sep 2024
Growth in half year ended Sep 2025 is 4.61% vs -0.17% in Sep 2024
Nine Monthly Results Snapshot (Consolidated) - Dec'25
YoY Growth in nine months ended Dec 2025 is 4.25% vs 1.08% in Dec 2024
YoY Growth in nine months ended Dec 2025 is 47.20% vs 6.04% in Dec 2024
Annual Results Snapshot (Consolidated) - Mar'26
YoY Growth in year ended Mar 2026 is 5.12% vs -0.92% in Mar 2025
YoY Growth in year ended Mar 2026 is 41.23% vs 3.62% in Mar 2025
About Hindustan Unilever Ltd

Company Coordinates


