
Compare Hind.Adhesive with Similar Stocks
Dashboard
Low ability to service debt as the company has a high Debt to EBITDA ratio of 2.71 times
- Low ability to service debt as the company has a high Debt to EBITDA ratio of 2.71 times
Poor long term growth as Net Sales has grown by an annual rate of -12.71% over the last 5 years
Flat results in Dec 25
Underperformed the market in the last 1 year
Stock DNA
Plastic Products - Industrial
INR 155 Cr (Micro Cap)
9.00
36
0.00%
1.00
17.16%
1.55
Total Returns (Price + Dividend) 
Latest dividend: 1.0000 per share ex-dividend date: Nov-21-2016
Risk Adjusted Returns v/s
Returns Beta

News
Hindustan Adhesives Ltd is Rated Sell
Hindustan Adhesives Ltd is rated 'Sell' by MarketsMOJO, with this rating last updated on 17 Nov 2025. However, the analysis and financial metrics discussed here reflect the company’s current position as of 24 June 2026, providing investors with an up-to-date perspective on the stock’s fundamentals, valuation, financial trends, and technical outlook.
Read full news articleWhen is the next results date for Hindustan Adhesives Ltd?
The next results date for Hindustan Adhesives Ltd is scheduled for June 25, 2026....
Read full news article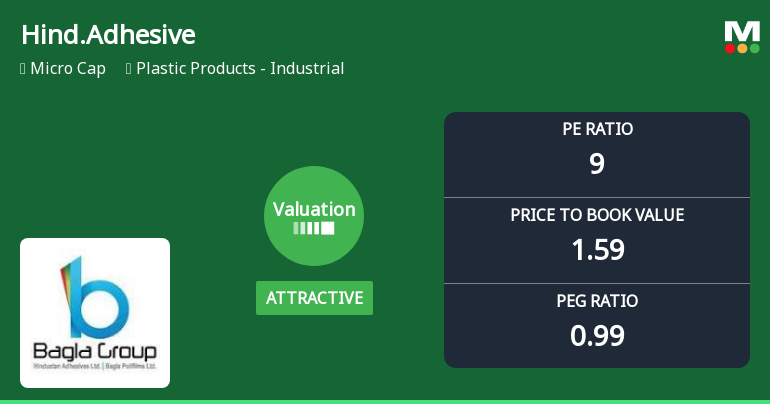
Hindustan Adhesives Ltd Valuation Shifts Signal Renewed Price Attractiveness
Hindustan Adhesives Ltd has witnessed a notable improvement in its valuation parameters, shifting from very attractive to attractive territory, signalling a potential change in investor sentiment. Despite a mixed performance relative to the Sensex over various time frames, the micro-cap player in the Plastic Products - Industrial sector shows signs of stabilising fundamentals and improved market perception.
Read full news article Announcements
Disclosure Of Reason For Delay In Submission Of Audited Standalone And Consolidated Financial Results For The Quarter And Financial Year Ended On March 31 2026 Pursuant To The Securities And Exchange Board Of India (SEBI) Circular CIR/CFD/CMD-1/142/2018 D
15-Jun-2026 | Source : BSEDisclosure of reason for delay in submission of Audited Standalone and Consolidated financial results for the quarter and financial year ended on March 31 2026.
Board Meeting Intimation for Intimation For Rescheduling Of Board Meeting
15-Jun-2026 | Source : BSEHindustan Adhesives Ltdhas informed BSE that the meeting of the Board of Directors of the Company is scheduled on 25/06/2026 inter alia to consider and approve With reference to our intimation dated June 01st 2026 please note that the meeting of the Board of Directors of the Company that was scheduled to be held on Monday June 15th 2026 is rescheduled as the finalization and closure of the Companys books of accounts for the financial year ended March 31 2026 are still in progress. Consequently PT. Bagla Group Indonesia the Companys wholly owned foreign subsidiary is in its first year of operations. Owing to the additional time required for finalization and audit of its first-year financial statements the subsidiarys audited financial information is still under completion. As a result the consolidation process for the Companys Audited Consolidated Financial Statements has not yet been completed and now the meeting of the Board of Directors will take place on Thursday June 25th 2026
Disclosure Of Reason For Delay In Submission Of Audited Standalone And Consolidated Financial Results For The Quarter And Financial Year Ended On March 31 2026 Pursuant To The Securities And Exchange Board Of India (SEBI) Circular CIR/CFD/CMD-1/142/2018 D
01-Jun-2026 | Source : BSEDisclosure of reason for delay in submission of Audited Standalone and Consolidated Financial Results for the quarter and financial year ended on 31 March 2026
Corporate Actions

25 Jun 2026

Hindustan Adhesives Ltd has declared 10% dividend, ex-date: 21 Nov 16

No Splits history available

No Bonus history available

No Rights history available
Quality key factors
Valuation key factors
Technicals key factors
 Technical Indicator Scale: Bearish, Mildly Bearish, Sideways, Mildly Bullish, Bullish Turned
 Shareholding Snapshot : Mar 2026
Shareholding Compare (%holding)
Promoters
None
Held by 0 Schemes
Held by 0 FIIs
Madhusudan Bagla (15.88%)
Saphire Hospitality Management Pvt Limited (4.99%)
18.2%
Quarterly Results Snapshot (Consolidated) - Dec'25 - QoQ

QoQ Growth in quarter ended Dec 2025 is 3.46% vs -2.62% in Sep 2025

QoQ Growth in quarter ended Dec 2025 is -21.02% vs 52.27% in Sep 2025
Half Yearly Results Snapshot (Consolidated) - Sep'25
Growth in half year ended Sep 2025 is -11.76% vs -8.45% in Sep 2024
Growth in half year ended Sep 2025 is 26.13% vs -7.64% in Sep 2024
Nine Monthly Results Snapshot (Consolidated) - Dec'25
YoY Growth in nine months ended Dec 2025 is -10.46% vs -4.95% in Dec 2024
YoY Growth in nine months ended Dec 2025 is 15.55% vs -4.58% in Dec 2024
Annual Results Snapshot (Consolidated) - Mar'25
YoY Growth in year ended Mar 2025 is -6.36% vs -5.36% in Mar 2024
YoY Growth in year ended Mar 2025 is -6.22% vs 236.96% in Mar 2024
About Hindustan Adhesives Ltd

Company Coordinates


