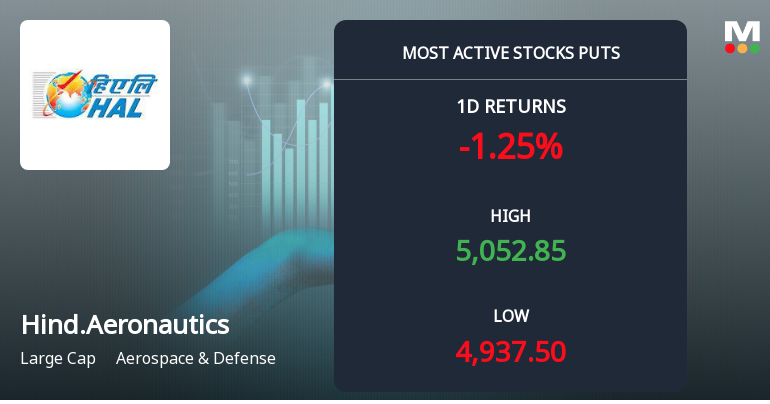
Hind.Aeronautics

  • Market Cap: Large Cap
  • Industry: Aerospace & Defense
  • ISIN: INE066F01020
  • NSEID: HAL
  • BSEID: 541154
INR
4,905.00
-45 (-0.91%)
BSENSE

Sep 11, 03:30 PM

BSE+NSE Vol: 9.29 lacs

  • Price Points
  • Score
  • Mojo Parameters
  • Total Return
  • News and Corporate Actions
  • Key factors
  • Shareholding
  • Financials
  • CompanyCV
stock-summaryPrice Point
High/Low

1Day

52 Week

Valuation
Technical
Day's Volume

CASH

9.29 lacs (-35.22%) Volume

Shareholding (Jun 2026)

FII

9.34%

Held by 638 FIIs

DII

11.97%

Held by 50 DIIs

Promoter

71.64%

Why is Hindustan Aeronautics Ltd falling/rising?

06-Sep-2026

As of 05-Sep, Hindustan Aeronautics Ltd's stock price is rising to Rs 4,850.00, supported by strong performance metrics and institutional backing. The stock has outperformed the sector and benchmarks, with significant gains year-to-date and over the last three years.

As of 05-Sep, Hindustan Aeronautics Ltd's stock price is rising, currently at Rs 4,850.00, reflecting an increase of Rs 70.05 or 1.47%. This upward movement is supported by several factors. The stock has outperformed the sector by 1.34% today and has been on a consecutive gain streak for the last two days, accumulating a total return of 1.51% during this period. Additionally, the stock reached an intraday high of Rs 4,934.95, marking a rise of 3.24%.<BR><BR>In terms of performance relative to benchmarks, Hindustan Aeronautics Ltd has shown strong returns over various periods, including a 10.54% increase year-to-date and a remarkable 144.73% rise over the last three years, significantly outperforming the Sensex, which has seen a decline of 10.21% in the same timeframe. The company also boasts a healthy long-term growth profile, with an average Return on Equity (ROE) of 24.66% and an operating profit growth rate of 16.21% annually. <BR><BR>Moreover, the stock benefits from high institutional holdings at 21.32%, indicating confidence from more sophisticated investors who have increased their stake by 0.61% over the previous quarter. This institutional backing, combined with the company's net-debt-free status and substantial market capitalization of Rs 3,24,356 crore, reinforces its position as a leader in the sector, constituting 42.98% of the entire industry.<BR><BR>Overall, the combination of strong performance metrics, institutional support, and positive market sentiment contributes to the rising stock price of Hindustan Aeronautics Ltd.

View full answer

Should I buy, sell or hold Hindustan Aeronautics Ltd?

02-Sep-2026

Who are in the management team of Hind.Aeronautics?

01-Sep-2026

The management team of Hind.Aeronautics includes C B Ananthakrishnan (Chairman & Managing Director), EJIPURA PUTHRAPPA JAYADEVA (Executive Director - HR), D K Sunil (Director - Engineering), and several other directors, bringing diverse expertise to the company's strategic and operational management.

The management team of Hind.Aeronautics includes the following key members:<BR><BR>1. **C B Ananthakrishnan** - Chairman & Managing Director & Director (Finance)<BR>2. **EJIPURA PUTHRAPPA JAYADEVA** - Executive Director - Human Resources<BR>3. **D K Sunil** - Director (Engineering)<BR>4. **T Natarajan** - Non-Executive Director / Nominee<BR>5. **Tessy Thomas** - Non-Executive Director / Nominee<BR>6. **Divya Gupta** - Independent Non-Executive Director<BR>7. **Deepak Abasaheb Shinde** - Independent Non-Executive Director<BR>8. **Atasi Baran Pradhan** - Executive Director (HR)<BR>9. **M Z Siddique** - Nominee (Government)<BR><BR>This team brings a diverse range of expertise to the company, contributing to its strategic direction and operational management.

View full answer

What does Hind.Aeronautics do?

01-Sep-2026

Hindustan Aeronautics Limited (HAL) is a Public Sector Enterprise in the Aerospace & Defense industry, focusing on the design, development, and manufacturing of aerospace products. As of June 2026, it reported net sales of ₹5,515 Cr and a net profit of ₹1,590 Cr, with a market cap of ₹320,377 Cr.

Overview:<BR>Hindustan Aeronautics Limited (HAL) is a Public Sector Enterprise engaged in the design, development, manufacture, repair, overhaul, upgrade, and servicing of aerospace products, operating within the Aerospace & Defense industry and categorized as a Large Cap company.<BR><BR>History:<BR>Hindustan Aeronautics Ltd was incorporated as a Public Sector Enterprise and is under the administrative control of the Ministry of Defence. The latest quarterly results reported are for June 2026, showing net sales and profit figures.<BR><BR>Financial Snapshot:<BR>- Net Sales: 5,515 Cr (Quarterly Results - Jun 2026)<BR>- Net Profit: 1,590 Cr (Quarterly Results - Jun 2026)<BR>- Market Cap: INR 320,377 Cr (Large Cap)<BR><BR>Key Metrics:<BR>- P/E: 34.00<BR>- Industry P/E: 45<BR>- Dividend Yield: 0.93%<BR>- Debt Equity: -1.13<BR>- Return on Equity: 22.21%<BR>- Price to Book: 7.90<BR><BR>Contact Details:<BR>Address: Post Box No 5150, 15/1 Cubbon Road Bangalore Karnataka : 560001<BR>Tel: 91-080-22320001<BR>Email: cosec@hal-india.com<BR>Website: http://www.hal-india.com

View full answer

Who are the peers of the Hind.Aeronautics?

01-Sep-2026

Hind.Aeronautics' peers include Bharat Electron, Mazagon Dock, Bharat Dynamics, Cochin Shipyard, and others. Hind.Aeronautics shows excellent management and growth, with a 1-year return of 10.64%, while MTAR Technologie leads in returns at 404.19%.

Peers: The peers of Hind.Aeronautics are Bharat Electron, Mazagon Dock, Bharat Dynamics, Cochin Shipyard, Garden Reach Sh., Data Pattern, MTAR Technologie, Zen Technologies, and Astra Microwave.<BR><BR>Quality Snapshot: Excellent management risk is observed at Hind.Aeronautics, Bharat Electron, Mazagon Dock, Garden Reach Sh., and the rest. Good management risk is found at Bharat Dynamics, Cochin Shipyard, Data Pattern, Zen Technologies, and the rest. Average management risk is present at MTAR Technologie, while Below Average management risk is noted at Sigma Advanced S. Growth is excellent for Hind.Aeronautics, Bharat Electron, Mazagon Dock, Garden Reach Sh., and Zen Technologies, while good growth is seen at MTAR Technologie. Below average growth is found at Bharat Dynamics and Cochin Shipyard, with average growth at Data Pattern and Astra Microwave.<BR><BR>Return Snapshot: MTAR Technologie has the highest 1-year return at 404.19%, while Bharat Dynamics has the lowest at -11.23%. Hind.Aeronautics' 1-year return of 10.64% is better than Bharat Dynamics but lower than MTAR Technologie. Additionally, Bharat Electron, Mazagon Dock, Bharat Dynamics, Cochin Shipyard, and Garden Reach Sh. all have negative six-month returns.

View full answer

How big is Hind.Aeronautics?

01-Sep-2026

As of 31st August, Hindustan Aeronautics Ltd has a market capitalization of 320,377.00 Cr, with recent Net Sales of 33,784.98 Cr and a Net Profit of 9,321.51 Cr.

As of 31st August, Hindustan Aeronautics Ltd has a market capitalization of 320,377.00 Cr, categorizing it as a Large Cap company.<BR><BR>In the latest four quarters, the company reported Net Sales of 33,784.98 Cr and a Net Profit of 9,321.51 Cr.<BR><BR>The latest annual period for the balance sheet is March 2026, with Shareholder's Funds amounting to 41,041.12 Cr and Total Assets of 1,31,279.83 Cr.

View full answer

Are Hindustan Aeronautics Ltd latest results good or bad?

15-May-2026

Hindustan Aeronautics Ltd reported strong Q4 FY26 results with a 124.79% increase in net profit and 81.10% revenue growth quarter-on-quarter. However, year-on-year growth was modest, and slight margin contraction raises concerns about sustainability, suggesting investors should remain cautious.

Hindustan Aeronautics Ltd (HAL) has reported strong results for Q4 FY26, showcasing significant growth in both revenue and net profit compared to the previous quarter. The net profit reached ₹4,196 crore, marking a remarkable increase of 124.79% quarter-on-quarter, while revenue surged to ₹13,942 crore, up 81.10% QoQ. The PAT margin also improved to 30.10%, reflecting a robust performance.<BR><BR>However, it's important to note that year-on-year growth figures were more modest, with revenue increasing by just 1.77% and net profit by 5.52%. This indicates that while the quarterly results are impressive, the overall year-on-year performance has not been as strong, primarily due to a high base effect from the previous year.<BR><BR>Additionally, HAL's operating margin has contracted slightly, which raises concerns about cost pressures despite the strong revenue growth. The company's ability to maintain profitability amidst these challenges will be crucial moving forward.<BR><BR>In summary, while the latest quarterly results are good in terms of sequential growth, the year-on-year performance and margin compression suggest that there are underlying challenges that need to be addressed. Overall, HAL's strong financial fundamentals and market position in the aerospace and defense sector remain positive, but investors should remain cautious about the sustainability of this growth.

View full answer

When is the next results date for Hindustan Aeronautics Ltd?

05-May-2026

The next results date for Hindustan Aeronautics Ltd is 14 May 2026.

The next results date for Hindustan Aeronautics Ltd is scheduled for 14 May 2026.

View full answer

Has Hindustan Aeronautics Ltd declared dividend?

13-Feb-2026

Hindustan Aeronautics Ltd has declared a 700% dividend, with an ex-date of February 18, 2026, and a dividend yield of 0.96%. The company has shown significant total returns over various periods, with long-term price appreciation greatly exceeding dividend returns.

Hindustan Aeronautics Ltd has declared a 700% dividend.<BR><BR>Dividend Details:<BR>- Percentage announced: 700%<BR>- Ex-date: 18 Feb 26<BR><BR>Dividend Yield: 0.96%.<BR><BR>Total Returns by Period:<BR>In the last 3 months, the price return was -11.3%, the dividend return was 0.73%, resulting in a total return of -10.57%.<BR><BR>Over the past 6 months, the price return was -6.88%, with a dividend return of 1.11%, leading to a total return of -5.77%.<BR><BR>In the last year, the price return was 15.11%, the dividend return was 1.50%, which culminated in a total return of 16.61%.<BR><BR>For the 2-year period, the price return was 44.14%, the dividend return was 2.89%, resulting in a total return of 47.03%.<BR><BR>In the 3-year span, the price return was 244.35%, with a dividend return of 10.80%, leading to a total return of 255.15%.<BR><BR>Over the last 4 years, the price return was 511.01%, the dividend return was 26.47%, culminating in a total return of 537.48%.<BR><BR>In the 5-year period, the price return was 721.32%, with a dividend return of 40.54%, resulting in a total return of 761.86%.<BR><BR>Overall, Hindustan Aeronautics Ltd has demonstrated significant growth in total returns over various periods, with a notable dividend declaration indicating a strong commitment to returning value to shareholders. The dividend yield of 0.96% suggests that while the company is rewarding shareholders, the returns from price appreciation have been substantially higher in the long term.

View full answer

Is Hind.Aeronautics technically bullish or bearish?

05-Dec-2025

As of December 4, 2025, Hind.Aeronautics shows a neutral technical stance with mixed indicators, including mildly bearish weekly and monthly MACD, a lack of momentum in RSI, and mildly bullish daily moving averages, suggesting no strong bullish or bearish momentum.

As of 4 December 2025, the technical trend for Hind.Aeronautics has changed from mildly bearish to sideways. The current technical stance is neutral, with mixed indicators influencing this view. The weekly MACD remains mildly bearish, while the monthly MACD is also mildly bearish. The RSI shows no signal on both weekly and monthly time frames, indicating a lack of momentum. Moving averages on the daily chart are mildly bullish, suggesting some short-term strength. However, the weekly Bollinger Bands are bearish, and the KST is bullish on a weekly basis but mildly bearish monthly. The Dow Theory indicates a mildly bearish stance on the weekly chart, with no trend on the monthly. Overall, the mixed signals suggest a neutral stance with no strong bullish or bearish momentum at this time.

View full answer

How has been the historical performance of Hind.Aeronautics?

13-Nov-2025

Hind.Aeronautics has shown consistent growth, with net sales increasing to 30,980.95 Cr in Mar'25 from 30,381.08 Cr in Mar'24, despite rising raw material costs. Operating profit rose to 12,169.77 Cr, and profit after tax reached 8,323.40 Cr, reflecting strong operational efficiency and improved shareholder value.

Answer:<BR>The historical performance of Hind.Aeronautics shows a consistent growth trend in net sales and profits over the years, with net sales reaching 30,980.95 Cr in Mar'25, up from 30,381.08 Cr in Mar'24 and significantly higher than 26,927.46 Cr in Mar'23. The total operating income mirrored this growth, reflecting the same values as net sales. However, the raw material costs surged to 19,234.46 Cr in Mar'25 from 12,346.33 Cr in Mar'24, impacting the overall expenditure, which increased to 21,372.87 Cr in Mar'25 from 20,640.02 Cr in Mar'24. Despite rising costs, the operating profit (PBDIT) increased to 12,169.77 Cr in Mar'25, up from 11,637.66 Cr in Mar'24, indicating a strong operational efficiency. The profit before tax also rose to 10,826.61 Cr in Mar'25, compared to 10,198.38 Cr in Mar'24, leading to a profit after tax of 8,323.40 Cr in Mar'25, up from 7,594.45 Cr in Mar'24. The earnings per share (EPS) increased to 125.07 in Mar'25 from 113.95 in Mar'24, showcasing improved shareholder value. On the balance sheet, total assets rose significantly to 1,04,698.86 Cr in Mar'25 from 76,640.85 Cr in Mar'24, while total liabilities also increased to 1,04,698.86 Cr in Mar'25 from 76,640.85 Cr in Mar'24, reflecting a growing scale of operations. Cash flow from operating activities improved to 13,643.00 Cr in Mar'25 from 8,222.00 Cr in Mar'24, indicating strong cash generation capabilities.<BR><BR>Breakdown:<BR>Hind.Aeronautics has demonstrated robust growth in its financial performance over the years, with net sales climbing steadily from 19,893.88 Cr in Mar'19 to 30,980.95 Cr in Mar'25. This upward trajectory is mirrored in total operating income, which has consistently aligned with net sales figures. The company faced rising raw material costs, which surged to 19,234.46 Cr in Mar'25, contributing to an increase in total expenditure to 21,372.87 Cr. Despite these challenges, operating profit (PBDIT) rose to 12,169.77 Cr, reflecting effective cost management. Profit before tax also saw a significant increase, reaching 10,826.61 Cr in Mar'25, which translated into a profit after tax of 8,323.40 Cr. The earnings per share improved to 125.07, indicating enhanced profitability for shareholders. On the balance sheet, total assets grew to 1,04,698.86 Cr, alongside total liabilities, which also increased, reflecting the company's expanding operations. The cash flow from operating activities further highlights the company's financial health, with a notable rise to 13,643.00 Cr in Mar'25, showcasing its ability to generate cash effectively.

View full answer

Who are the top shareholders of the Hind.Aeronautics?

17-Jul-2025

The top shareholders of Hind.Aeronautics include the President of India with 71.64%, foreign institutional investors at 12.08%, mutual funds at 4.31%, and the Life Insurance Corporation of India holding 2.72%. Individual investors collectively own 7.02% of the shares.

The top shareholders of Hind.Aeronautics are primarily the promoters, with the President of India holding the largest stake at 71.64%. In addition to the promoter holdings, foreign institutional investors (FIIs) hold 12.08% of the company, while mutual funds account for 4.31% through 39 different schemes. The highest public shareholder is the Life Insurance Corporation of India, which holds 2.72%. Individual investors collectively own 7.02% of the shares.

View full answer

Is Hind.Aeronautics overvalued or undervalued?

09-Jun-2025

As of June 5, 2023, Hindustan Aeronautics Ltd. is considered very expensive and overvalued, with a high PE ratio of 39.90 and other elevated valuation metrics, despite strong year-to-date returns.

As of 5 June 2023, the valuation grade for Hindustan Aeronautics Ltd. has moved from expensive to very expensive, indicating a significant increase in perceived valuation. The company is currently deemed overvalued based on its high ratios, including a PE ratio of 39.90, an EV to EBITDA ratio of 30.74, and a PEG ratio of 4.12. These metrics suggest that the stock price is not justified by its earnings growth potential.<BR><BR>In comparison to its peers, Hindustan Aeronautics Ltd. stands out with a PE ratio of 39.90, which is notably higher than many competitors in the aerospace sector. For instance, if we consider similar companies, their PE ratios typically range lower, indicating that Hindustan Aeronautics may be trading at a premium. Furthermore, while the company has shown strong returns, such as a 20.05% YTD return compared to the Sensex's 5.56%, this performance does not sufficiently mitigate the concerns regarding its current valuation levels. Overall, the stock appears to be overvalued in the current market context.

View full answer
iScoreScore
Click here to find our call on this stock
Strong Sell
Sell
Hold
Buy
Strong Buy

Dashboard

1

Strong Long Term Fundamental Strength with an average Return on Equity (ROE) of 24.66%

  • Healthy long term growth as Operating profit has grown by an annual rate 16.21%
  • The company is Net-Debt Free
2

Flat results in Jun 26

3

With ROE of 22.2, it has a Very Expensive valuation with a 8 Price to Book Value

4

High Institutional Holdings at 21.32%

5

Consistent Returns over the last 3 years

stock-summaryMojo Parameters

Mojo Parameters

Loading Valuation Snapshot...

Stock DNA

stock-summary
Industry

Aerospace & Defense

stock-summary
Market cap

INR 327,365 Cr (Large Cap)

stock-summary
P/E

35.00

stock-summary
Industry P/E

45

stock-summary
Dividend Yield

0.91%

stock-summary
Debt Equity

-1.13

stock-summary
Return on Equity

22.21%

stock-summary
Price to Book

8.07

Revenue and Profits:
Net Sales:
5,515 Cr
(Quarterly Results - Jun 2026)
Net Profit:
1,590 Cr
stock-summaryTotal Returns
Total Returns (Price + Dividend) stock-summary
Dividend Yield (0.91%)
TimePeriod
Price Return
Dividend Return
Total Return
3 Months
17.56%
0.23%
17.79%
6 Months
22.47%
0.25%
22.72%
1 Year
7.07%
0.92%
7.99%
2 Years
6.66%
1.93%
8.59%
3 Years
140.28%
6.13%
146.41%
4 Years
303.06%
11.91%
314.97%
5 Years
613.82%
25.28%
639.1%

Latest dividend: 10 per share ex-dividend date: Aug-14-2026

Risk Adjusted Returns v/s stock-summary
Returns Beta
Icon
Beta has not been calculated since enough price history is not available
stock-summaryNews & Corporate Actions

News

Announcements stock-summary

Hindustan Aeronautics Limited - Strikes/Lockouts/Disturbances

23-Oct-2019 | Source : NSE

Strikes/Lockouts/Disturbances Update on Indefinite Strike by Workmen Unions of the Company

Hindustan Aeronautics Limited - Trading Window

25-Sep-2019 | Source : NSE

Hindustan Aeronautics Limited has informed the Exchange regarding the Trading Window closure pursuant to SEBI (Prohibition of Insider Trading) Regulations, 2015

Shareholders meeting

20-Sep-2019 | Source : NSE

Hindustan Aeronautics Limited has submitted the Exchange a copy Srutinizers report of Annual General Meeting held on September 18, 2019. Further, the company has informed the Exchange regarding voting results.

Corporate Actions stock-summary

stock-summary
BOARD MEETING

No Upcoming Board Meetings

stock-summary
DIVIDEND

Hindustan Aeronautics Ltd has declared 200% dividend, ex-date: 14 Aug 26

stock-summary
SPLITS

Hindustan Aeronautics Ltd has announced 5:10 stock split, ex-date: 28 Sep 23

stock-summary
BONUS

No Bonus history available

stock-summary
RIGHTS

No Rights history available

stock-summaryKey Factors

Quality key factors stock-summary

Factor
Value
Sales Growth (5y)
8.34%
EBIT Growth (5y)
16.21%
EBIT to Interest (avg)
100.00
Debt to EBITDA (avg)
Net Debt is too low
Net Debt to Equity (avg)
-1.13
Sales to Capital Employed (avg)
1.08
Tax Ratio
25.02%
Dividend Payout Ratio
31.98%
Pledged Shares
0
Institutional Holding
21.32%
ROCE (avg)
78.73%
ROE (avg)
24.66%

Valuation key factors

Factor
Value
P/E Ratio
35
Industry P/E
45
Price to Book Value
7.98
EV to EBIT
32.95
EV to EBITDA
28.10
EV to Capital Employed
-54.70
EV to Sales
8.33
PEG Ratio
2.88
Dividend Yield
0.92%
ROCE (Latest)
Negative Capital Employed
ROE (Latest)
22.21%

Technicals key factors

Indicator
Weekly
Monthly
MACD
Bullish
Mildly Bearish
RSI
No Signal
No Signal
Bollinger Bands
Bullish
Bullish
Moving Averages
Bullish (Daily)
KST
Bullish
Mildly Bearish
Dow Theory
Mildly Bearish
No Trend
OBV
Mildly Bearish
No Trend
stock-summary Technical Indicator Scale: Bearish, Mildly Bearish, Sideways, Mildly Bullish, Bullish  Turned 
stock-summaryShareholding
Shareholding Snapshot : Jun 2026stock-summary
Shareholding Compare (%holding) stock-summary
Majority shareholders

Promoters

Pledged Promoter Holdings

None

Mutual Funds

Held by 39 Schemes (6.79%)

FIIs

Held by 638 FIIs (9.34%)

Promoter with highest holding

President Of India (71.64%)

Highest Public shareholder

Life Insurance Corporation Of India (3.35%)

Individual Investors Holdings

6.14%

stock-summaryFinancial
[
  {
    "link": "quarterly",
    "btn_text": "All Quarterly Results",
    "header": "Quarterly Results Snapshot (Consolidated) - Jun'26 - YoY",
    "rhs": [
      {
        "prefix": "Net Sales ",
        "suffix": "YoY Growth in quarter ended Jun 2026 is 14.45% vs 10.85% in Jun 2025",
        "dir": 1
      },
      {
        "prefix": "Consolidated Net Profit ",
        "suffix": "YoY Growth in quarter ended Jun 2026 is 14.88% vs -3.71% in Jun 2025",
        "dir": 1
      }
    ],
    "table": {
      "header": [
        "Jun'26",
        "Jun'25",
        "Change(%)"
      ],
      "body": [
        {
          "field": "Net Sales",
          "val1": "5,515.17",
          "val2": "4,819.01",
          "chgp": "14.45%",
          "chgp_class": "positive"
        },
        {
          "field": "Operating Profit (PBDIT) excl Other Income",
          "val1": "1,526.77",
          "val2": "1,282.40",
          "chgp": "19.06%",
          "chgp_class": "positive"
        },
        {
          "field": "Interest",
          "val1": "0.35",
          "val2": "0.30",
          "chgp": "16.67%",
          "chgp_class": "negative"
        },
        {
          "field": "Exceptional Items",
          "val1": "0.00",
          "val2": "0.00",
          "chgp": "",
          "chgp_class": "neutral"
        },
        {
          "field": "Consolidate Net Profit",
          "val1": "1,589.68",
          "val2": "1,383.77",
          "chgp": "14.88%",
          "chgp_class": "positive"
        },
        {
          "field": "Operating Profit Margin (Excl OI)",
          "val1": "27.68%",
          "val2": "26.61%",
          "chgp": "1.07%",
          "chgp_class": "positive"
        }
      ]
    }
  },
  {
    "link": "half-yearly",
    "btn_text": "All Half Yearly Results",
    "header": "Half Yearly Results Snapshot (Consolidated) - Sep'25",
    "rhs": [
      {
        "prefix": "Net Sales ",
        "suffix": " Growth in half year ended Sep 2025 is 10.89% vs 8.09% in Sep 2024",
        "dir": 1
      },
      {
        "prefix": "Consolidated Net Profit ",
        "suffix": " Growth in half year ended Sep 2025 is 3.57% vs 43.72% in Sep 2024",
        "dir": -1
      }
    ],
    "table": {
      "header": [
        "Sep'25",
        "Sep'24",
        "Change(%)"
      ],
      "body": [
        {
          "field": "Net Sales",
          "val1": "11,447.62",
          "val2": "10,323.79",
          "chgp": "10.89%",
          "chgp_class": "positive"
        },
        {
          "field": "Operating Profit (PBDIT) excl Other Income",
          "val1": "2,840.29",
          "val2": "2,630.67",
          "chgp": "7.97%",
          "chgp_class": "positive"
        },
        {
          "field": "Interest",
          "val1": "0.66",
          "val2": "0.16",
          "chgp": "312.50%",
          "chgp_class": "negative"
        },
        {
          "field": "Exceptional Items",
          "val1": "0.00",
          "val2": "5.89",
          "chgp": "-100.00%",
          "chgp_class": "negative"
        },
        {
          "field": "Consolidate Net Profit",
          "val1": "3,052.84",
          "val2": "2,947.64",
          "chgp": "3.57%",
          "chgp_class": "positive"
        },
        {
          "field": "Operating Profit Margin (Excl OI)",
          "val1": "24.81%",
          "val2": "25.48%",
          "chgp": "-0.67%",
          "chgp_class": "negative"
        }
      ]
    }
  },
  {
    "link": "nine-monthly",
    "btn_text": "All Nine Monthly Results",
    "header": "Nine Monthly Results Snapshot (Consolidated) - Dec'25",
    "rhs": [
      {
        "prefix": "Net Sales ",
        "suffix": "YoY Growth in nine months ended Dec 2025 is 10.79% vs 10.69% in Dec 2024",
        "dir": 1
      },
      {
        "prefix": "Consolidated Net Profit ",
        "suffix": "YoY Growth in nine months ended Dec 2025 is 12.13% vs 32.46% in Dec 2024",
        "dir": -1
      }
    ],
    "table": {
      "header": [
        "Dec'25",
        "Dec'24",
        "Change(%)"
      ],
      "body": [
        {
          "field": "Net Sales",
          "val1": "19,146.42",
          "val2": "17,281.10",
          "chgp": "10.79%",
          "chgp_class": "positive"
        },
        {
          "field": "Operating Profit (PBDIT) excl Other Income",
          "val1": "4,711.26",
          "val2": "4,313.18",
          "chgp": "9.23%",
          "chgp_class": "positive"
        },
        {
          "field": "Interest",
          "val1": "1.64",
          "val2": "0.24",
          "chgp": "583.33%",
          "chgp_class": "negative"
        },
        {
          "field": "Exceptional Items",
          "val1": "0.00",
          "val2": "5.89",
          "chgp": "-100.00%",
          "chgp_class": "negative"
        },
        {
          "field": "Consolidate Net Profit",
          "val1": "4,919.52",
          "val2": "4,387.47",
          "chgp": "12.13%",
          "chgp_class": "positive"
        },
        {
          "field": "Operating Profit Margin (Excl OI)",
          "val1": "24.61%",
          "val2": "24.96%",
          "chgp": "-0.35%",
          "chgp_class": "negative"
        }
      ]
    }
  },
  {
    "link": "annual",
    "btn_text": "All Annual Results",
    "header": "Annual Results Snapshot (Consolidated) - Mar'26",
    "rhs": [
      {
        "prefix": "Net Sales ",
        "suffix": "YoY Growth in year ended Mar 2026 is 6.80% vs 1.97% in Mar 2025",
        "dir": 1
      },
      {
        "prefix": "Consolidated Net Profit ",
        "suffix": "YoY Growth in year ended Mar 2026 is 8.98% vs 9.75% in Mar 2025",
        "dir": -1
      }
    ],
    "table": {
      "header": [
        "Mar'26",
        "Mar'25",
        "Change(%)"
      ],
      "body": [
        {
          "field": "Net Sales",
          "val1": "33,088.82",
          "val2": "30,980.95",
          "chgp": "6.80%",
          "chgp_class": "positive"
        },
        {
          "field": "Operating Profit (PBDIT) excl Other Income",
          "val1": "9,769.83",
          "val2": "9,608.08",
          "chgp": "1.68%",
          "chgp_class": "positive"
        },
        {
          "field": "Interest",
          "val1": "5.79",
          "val2": "8.68",
          "chgp": "-33.29%",
          "chgp_class": "positive"
        },
        {
          "field": "Exceptional Items",
          "val1": "0.00",
          "val2": "5.89",
          "chgp": "-100.00%",
          "chgp_class": "negative"
        },
        {
          "field": "Consolidate Net Profit",
          "val1": "9,115.60",
          "val2": "8,364.13",
          "chgp": "8.98%",
          "chgp_class": "positive"
        },
        {
          "field": "Operating Profit Margin (Excl OI)",
          "val1": "29.53%",
          "val2": "31.01%",
          "chgp": "-1.48%",
          "chgp_class": "negative"
        }
      ]
    }
  }
]

Quarterly Results Snapshot (Consolidated) - Jun'26 - YoYstock-summary

Jun'26
Jun'25
Change(%)
Net Sales
5,515.17
4,819.01
14.45%
Operating Profit (PBDIT) excl Other Income
1,526.77
1,282.40
19.06%
Interest
0.35
0.30
16.67%
Exceptional Items
0.00
0.00
Consolidate Net Profit
1,589.68
1,383.77
14.88%
Operating Profit Margin (Excl OI)
27.68%
26.61%
1.07%
Values in Rs Cr.
Direction Arrows
Net Sales

YoY Growth in quarter ended Jun 2026 is 14.45% vs 10.85% in Jun 2025

Direction Arrows
Consolidated Net Profit

YoY Growth in quarter ended Jun 2026 is 14.88% vs -3.71% in Jun 2025

Half Yearly Results Snapshot (Consolidated) - Sep'25stock-summary

Sep'25
Sep'24
Change(%)
Net Sales
11,447.62
10,323.79
10.89%
Operating Profit (PBDIT) excl Other Income
2,840.29
2,630.67
7.97%
Interest
0.66
0.16
312.50%
Exceptional Items
0.00
5.89
-100.00%
Consolidate Net Profit
3,052.84
2,947.64
3.57%
Operating Profit Margin (Excl OI)
24.81%
25.48%
-0.67%
Values in Rs Cr.
Direction Arrows
Net Sales

Growth in half year ended Sep 2025 is 10.89% vs 8.09% in Sep 2024

Direction Arrows
Consolidated Net Profit

Growth in half year ended Sep 2025 is 3.57% vs 43.72% in Sep 2024

Nine Monthly Results Snapshot (Consolidated) - Dec'25stock-summary

Dec'25
Dec'24
Change(%)
Net Sales
19,146.42
17,281.10
10.79%
Operating Profit (PBDIT) excl Other Income
4,711.26
4,313.18
9.23%
Interest
1.64
0.24
583.33%
Exceptional Items
0.00
5.89
-100.00%
Consolidate Net Profit
4,919.52
4,387.47
12.13%
Operating Profit Margin (Excl OI)
24.61%
24.96%
-0.35%
Values in Rs Cr.
Direction Arrows
Net Sales

YoY Growth in nine months ended Dec 2025 is 10.79% vs 10.69% in Dec 2024

Direction Arrows
Consolidated Net Profit

YoY Growth in nine months ended Dec 2025 is 12.13% vs 32.46% in Dec 2024

Annual Results Snapshot (Consolidated) - Mar'26stock-summary

Mar'26
Mar'25
Change(%)
Net Sales
33,088.82
30,980.95
6.80%
Operating Profit (PBDIT) excl Other Income
9,769.83
9,608.08
1.68%
Interest
5.79
8.68
-33.29%
Exceptional Items
0.00
5.89
-100.00%
Consolidate Net Profit
9,115.60
8,364.13
8.98%
Operating Profit Margin (Excl OI)
29.53%
31.01%
-1.48%
Values in Rs Cr.
Direction Arrows
Net Sales

YoY Growth in year ended Mar 2026 is 6.80% vs 1.97% in Mar 2025

Direction Arrows
Consolidated Net Profit

YoY Growth in year ended Mar 2026 is 8.98% vs 9.75% in Mar 2025

stock-summaryCompany CV
About Hindustan Aeronautics Ltd stock-summary
stock-summary
Hindustan Aeronautics Ltd
Large Cap
Aerospace & Defense
Hindustan Aeronautics Limited (HAL), is a Public Sector Enterprise and is under the administrative control of the Ministry of Defence. HAL is engaged in the design, development, manufacture, repair, overhaul, upgrade and servicing products including, aircraft, helicopters, aero-engines, avionics, accessories and aerospace structures. The Operations are organised into five complexes, i.e.
Company Coordinates stock-summary
Company Details
Post Box No 5150, 15/1 Cubbon Road Bangalore Karnataka : 560001
stock-summary
Tel: 91-080-22320001
stock-summary
cosec@hal-india.com
Registrar Details
Karvy Computershare Pvt Ltd., Karvy Selenium, Tower-B Plot No 31 & 32, Survey No 116/22, 115/24, 115/25, Financial District, Nanakramguda, Serilingampally, Mandal Ranga Reddy Dist, Hyderabad