
Compare Hind.Composites with Similar Stocks
Stock DNA
Auto Components & Equipments
INR 616 Cr (Micro Cap)
19.00
37
0.48%
-0.03
2.91%
0.54
Total Returns (Price + Dividend) 
Latest dividend: 2 per share ex-dividend date: Sep-18-2025
Risk Adjusted Returns v/s
Returns Beta

News

Hindustan Composites Ltd Technical Momentum Shifts Amid Bearish Signals
Hindustan Composites Ltd, a micro-cap player in the Auto Components & Equipments sector, has experienced a notable shift in its technical momentum, moving from a mildly bearish stance to a more pronounced bearish trend. Despite a modest day gain of 0.29%, the stock’s technical indicators reveal a complex picture that investors should carefully analyse before making decisions.
Read full news article
Hindustan Composites Ltd is Rated Sell
Hindustan Composites Ltd is rated 'Sell' by MarketsMOJO, with this rating last updated on 10 February 2026. However, the analysis and financial metrics discussed here reflect the stock's current position as of 15 June 2026, providing investors with an up-to-date view of the company’s fundamentals, returns, and market performance.
Read full news article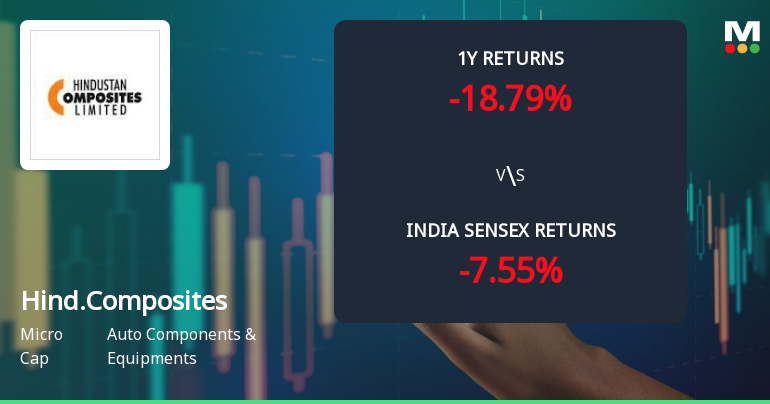
Hindustan Composites Ltd Sees Technical Momentum Shift Amid Mixed Market Signals
Hindustan Composites Ltd, a micro-cap player in the Auto Components & Equipments sector, has experienced a subtle shift in its technical momentum, moving from a bearish to a mildly bearish trend. Despite a modest 2.4% gain on 15 Jun 2026, the stock’s technical indicators present a complex picture, with some signals suggesting cautious optimism while others maintain a bearish outlook. This article analyses the recent technical parameter changes, key indicator readings, and the stock’s relative performance against the Sensex to provide a comprehensive view for investors.
Read full news article Announcements
Compliances-Reg.24(A)-Annual Secretarial Compliance
29-May-2026 | Source : BSEAnnual Secretarial Compliance Report for the Financial Year ended 31st March 2026
Announcement under Regulation 30 (LODR)-Newspaper Publication
27-May-2026 | Source : BSENewspaper Advertisement regarding special window for transfer and demat of physical shares.
Announcement under Regulation 30 (LODR)-Newspaper Publication
08-May-2026 | Source : BSENewspaper publication regarding Second 100 days Campaign - Saksham Niveshak
Corporate Actions

No Upcoming Board Meetings

Hindustan Composites Ltd has declared 40% dividend, ex-date: 18 Sep 25

Hindustan Composites Ltd has announced 5:10 stock split, ex-date: 25 May 17

Hindustan Composites Ltd has announced 1:2 bonus issue, ex-date: 25 May 17

No Rights history available
Quality key factors
Valuation key factors
Technicals key factors
 Technical Indicator Scale: Bearish, Mildly Bearish, Sideways, Mildly Bullish, Bullish Turned
 Shareholding Snapshot : Mar 2026
Shareholding Compare (%holding)
Promoters
None
Held by 1 Schemes (0.0%)
Held by 0 FIIs
Rasoi Limited (41.65%)
Tribeni Charitable Trust (1.9%)
13.78%
Quarterly Results Snapshot (Consolidated) - Mar'26 - QoQ

QoQ Growth in quarter ended Mar 2026 is 10.93% vs 6.69% in Dec 2025
QoQ Growth in quarter ended Mar 2026 is 75.41% vs 26.33% in Dec 2025
Half Yearly Results Snapshot (Consolidated) - Sep'25
Growth in half year ended Sep 2025 is 13.99% vs 4.53% in Sep 2024

Growth in half year ended Sep 2025 is -29.06% vs -10.11% in Sep 2024
Nine Monthly Results Snapshot (Consolidated) - Dec'25
YoY Growth in nine months ended Dec 2025 is 14.51% vs 7.68% in Dec 2024
YoY Growth in nine months ended Dec 2025 is -32.91% vs 9.42% in Dec 2024
Annual Results Snapshot (Consolidated) - Mar'26
YoY Growth in year ended Mar 2026 is 15.36% vs 9.20% in Mar 2025
YoY Growth in year ended Mar 2026 is -11.11% vs 1.71% in Mar 2025
About Hindustan Composites Ltd

Company Coordinates


