
Dashboard
Healthy long term growth as Net Sales has grown by an annual rate of 14.21% and Operating profit at 22.69%
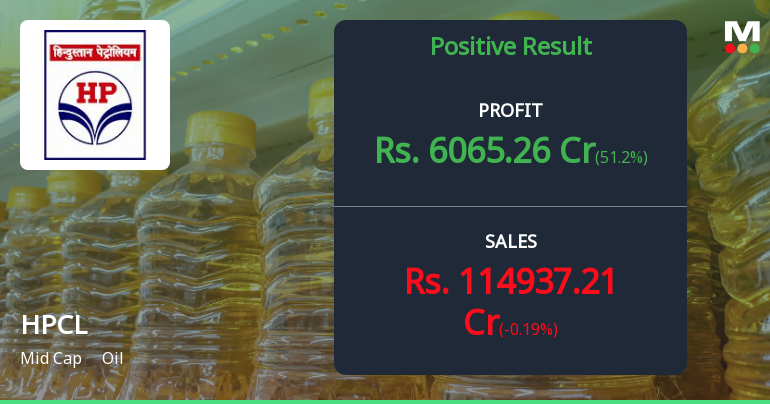
The company has declared Positive results for the last 5 consecutive quarters
With ROCE of 17.1, it has a Very Attractive valuation with a 1.2 Enterprise value to Capital Employed
High Institutional Holdings at 36.84%
Consistent Returns over the last 3 years
Total Returns (Price + Dividend) 
Latest dividend: 5 per share ex-dividend date: Nov-06-2025
Risk Adjusted Returns v/s
Returns Beta

News
HPCL Q4 FY26: Robust Profit Surge Masks Valuation Concerns
Hindustan Petroleum Corporation Ltd. (HPCL) delivered a strong finish to fiscal year 2026, with consolidated net profit surging 77.58% year-on-year to ₹6,065.26 crores in Q4 FY26, marking the company's best quarterly performance on record. However, despite the impressive earnings momentum and a market capitalisation of ₹79,208 crores, the stock faces headwinds from expensive valuations and bearish technical trends that have prompted a cautious "HOLD" rating from analysts.
Read full news article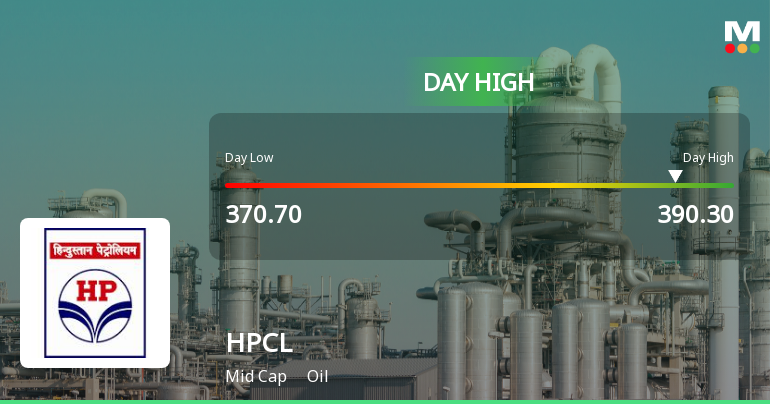
Hindustan Petroleum Corporation Ltd. Rallies 5.15% and Approaches 50 DMA Resistance — A Key Technical Test Ahead
The Sensex advanced 0.59% on 13 May 2026, yet Hindustan Petroleum Corporation Ltd. surged 5.15%, outperforming its Oil sector peers by nearly 3.85 percentage points. This sharp single-session gain stands out as a stock-specific event amid a market still grappling with bearish moving average configurations.
Read full news article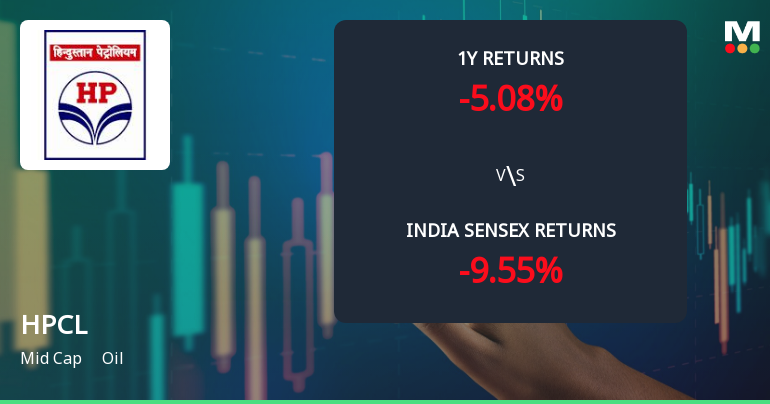
Hindustan Petroleum Corporation Ltd. Faces Bearish Technical Shift Amid Mixed Momentum Signals
Hindustan Petroleum Corporation Ltd. (HPCL) has experienced a notable shift in its technical momentum, with key indicators signalling a transition from mildly bearish to bearish trends. Despite a strong long-term performance, recent price action and technical signals suggest caution for investors as the stock navigates a challenging phase amid sectoral and market pressures.
Read full news article Announcements
Hindustan Petroleum Corporation Limited - Updates
05-Dec-2019 | Source : NSEHindustan Petroleum Corporation Limited has informed the Exchange regarding 'Revision in Ratings - Foreign Currency (USD) denominated Notes
Hindustan Petroleum Corporation Limited - Other General Purpose
28-Nov-2019 | Source : NSEHindustan Petroleum Corporation Limited has informed the Exchange regarding disclosure of Related Party Transactions for the half year ended September 30, 2019á pursuant to Regulation 23 (9) of the SEBI (Listing Obligations and Disclosure Requirements) Regulations, 2015.
Hindustan Petroleum Corporation Limited - Analysts/Institutional Investor Meet/Con. Call Updates
27-Nov-2019 | Source : NSEHindustan Petroleum Corporation Limitedimited has informed the Exchange regarding Analysts/Institutional Investor Meet/Con. Call Updates
Corporate Actions

(13 May 2026)

Hindustan Petroleum Corporation Ltd. has declared 50% dividend, ex-date: 06 Nov 25

No Splits history available

Hindustan Petroleum Corporation Ltd. has announced 1:2 bonus issue, ex-date: 21 Jun 24

No Rights history available
Quality key factors
Valuation key factors
Technicals key factors
 Technical Indicator Scale: Bearish, Mildly Bearish, Sideways, Mildly Bullish, Bullish Turned
 Shareholding Snapshot : Mar 2026
Shareholding Compare (%holding)
Promoters
None
Held by 38 Schemes (15.21%)
Held by 736 FIIs (17.27%)
Oil And Natural Gas Corporation Limited (54.9%)
Hdfc Mutual Fund - Hdfc Mid-cap Fund (4.76%)
6.6%
Quarterly Results Snapshot (Consolidated) - Mar'26 - QoQ

QoQ Growth in quarter ended Mar 2026 is -0.19% vs 14.18% in Dec 2025

QoQ Growth in quarter ended Mar 2026 is 51.20% vs 3.94% in Dec 2025
Half Yearly Results Snapshot (Consolidated) - Sep'25
Growth in half year ended Sep 2025 is -1.02% vs 2.90% in Sep 2024
Growth in half year ended Sep 2025 is 926.28% vs -93.83% in Sep 2024
Nine Monthly Results Snapshot (Consolidated) - Dec'25
YoY Growth in nine months ended Dec 2025 is 0.73% vs 1.66% in Dec 2024
YoY Growth in nine months ended Dec 2025 is 260.86% vs -75.05% in Dec 2024
Annual Results Snapshot (Consolidated) - Mar'26
YoY Growth in year ended Mar 2026 is 1.77% vs 0.06% in Mar 2025
YoY Growth in year ended Mar 2026 is 167.93% vs -57.94% in Mar 2025
About Hindustan Petroleum Corporation Ltd.

Company Coordinates


