Honda India

  • Market Cap: Small Cap
  • Industry: Industrial Manufacturing
  • ISIN: INE634A01018
  • NSEID: HONDAPOWER
  • BSEID: 522064
INR
2,104.30
8.3 (0.4%)
BSENSE

Aug 04, 03:30 PM

BSE+NSE Vol: 1.89 k

  • Price Points
  • Score
  • Mojo Parameters
  • Total Return
  • News and Corporate Actions
  • Key factors
  • Shareholding
  • Financials
  • CompanyCV
stock-summaryPrice Point
High/Low

1Day

52 Week

Valuation
Technical
Day's Volume

CASH

1.89 k (-66.75%) Volume

Shareholding (Jun 2026)

FII

0.98%

Held by 45 FIIs

DII

18.27%

Held by 18 DIIs

Promoter

66.67%

Why is Honda India Power Products Ltd falling/rising?

05-Aug-2026

As of 04-Aug, Honda India Power Products Ltd's stock is rising to 2,107.60, indicating a potential trend reversal after previous declines. Despite today's increase, the stock has underperformed over the long term, with a year-to-date decline of 9.93% and challenges in net sales and operating profit.

As of 04-Aug, Honda India Power Products Ltd's stock price is rising, with a current price of 2,107.60, reflecting a change of 13.05 (0.62%) upward. This increase comes after three consecutive days of decline, indicating a potential trend reversal. Additionally, there has been a notable rise in investor participation, with delivery volume increasing by 46.21% compared to the five-day average, suggesting renewed interest in the stock.<BR><BR>Despite the positive movement today, the stock has underperformed its sector by 0.62% and has shown a negative performance over longer periods, including a year-to-date decline of 9.93% and a one-year drop of 27.10%. However, the company maintains a strong financial position as it is net-debt free and offers a high dividend yield of 5.96%, which may attract income-focused investors.<BR><BR>The stock's valuation appears attractive with a price-to-book value of 2.7 and a return on equity (ROE) of 9.1, suggesting that it is trading at a fair value compared to its peers. Nevertheless, the company has faced challenges, including a decline in net sales and operating profit over the past five years, which could impact long-term growth prospects. Overall, while the stock is experiencing a rise today, its longer-term performance remains a concern for investors.

View full answer

Are Honda India Power Products Ltd latest results good or bad?

31-Jul-2026

Honda India Power Products Ltd's latest results show a year-on-year profit increase of 17.09% and revenue growth of 22.17%, but a significant quarter-on-quarter decline in net profit by 58.76% and revenue by 28.46% indicates operational challenges. Overall, while there are positive trends, the company needs to address cost management issues.

Honda India Power Products Ltd's latest results present a mixed picture. On one hand, the company reported a net profit of ₹11.10 crores for Q1 FY27, which reflects a 17.09% increase year-on-year. This indicates some resilience in profitability compared to the same quarter last year. Additionally, revenue for the quarter reached ₹189.25 crores, marking a significant year-on-year growth of 22.17%.<BR><BR>However, the sequential performance raises concerns. The net profit saw a sharp decline of 58.76% compared to the previous quarter, and revenue dropped by 28.46%. This decline is attributed to the seasonal nature of the power products industry, where Q1 typically experiences weaker demand. Furthermore, the operating margin fell to 7.62%, down 367 basis points from the previous quarter, indicating challenges in maintaining cost efficiency during this period.<BR><BR>Overall, while there are positive year-on-year growth figures, the significant quarter-on-quarter declines in both revenue and profit suggest that the company is facing operational challenges and may need to improve its cost management and efficiency to enhance profitability in the future.

View full answer

Should I buy, sell or hold Honda India Power Products Ltd?

31-Jul-2026

When is the next results date for Honda India Power Products Ltd?

22-Jul-2026

The next results date for Honda India Power Products Ltd is 30 July 2026.

The next results date for Honda India Power Products Ltd is scheduled for 30 July 2026.

View full answer

What does Honda India do?

11-Jun-2026

Honda India Power Products Ltd is a small-cap industrial manufacturing company that produces power products. As of March 2026, it reported net sales of ₹265 Cr and a net profit of ₹27 Cr, with a market cap of ₹2,244 Cr.

Overview:<BR>Honda India Power Products Ltd operates in the industrial manufacturing sector as a small-cap company.<BR><BR>History:<BR>The company was incorporated in September 1985 as a joint venture and was initially named Shriram Honda Power. It changed its name to Honda Siel Power Products Limited in 1998-99 and was renamed Honda India Power Products Limited on May 24, 2020. The latest quarterly results reported net sales and profit for March 2026.<BR><BR>Financial Snapshot:<BR>Net Sales: 265 Cr (Quarterly Results - Mar 2026) <BR>Net Profit: 27 Cr (Quarterly Results - Mar 2026) <BR>Market Cap: INR 2,244 Cr (Small Cap)<BR><BR>Key Metrics:<BR>P/E: 31.00 <BR>Industry P/E: 58 <BR>Dividend Yield: 5.61% <BR>Debt-Equity: -0.10 <BR>Return on Equity: 8.90% <BR>Price to Book: 2.81 <BR><BR>Contact Details:<BR>Address: 409 DLF Tower B, Jasola Commercial Complex New Delhi New Delhi : 110025 <BR>Website: http://www.hondaindiapower.com

View full answer

How big is Honda India?

11-Jun-2026

As of 10th June, Honda India Power Products Ltd has a market capitalization of 2,244.00 Cr, classifying it as a Small Cap company, with recent net sales of 865.45 Cr and a net profit of 64.24 Cr.

As of 10th June, Honda India Power Products Ltd has a market capitalization of 2,244.00 Cr, which categorizes it as a Small Cap company.<BR><BR>In the latest 4 quarters, Honda India reported Net Sales of 865.45 Cr and a Net Profit of 64.24 Cr.<BR><BR>For the latest annual period ending March 2025, the company had Shareholder's Funds of 863.53 Cr and Total Assets amounting to 1,034.26 Cr.

View full answer

Who are in the management team of Honda India?

11-Jun-2026

The management team of Honda India includes Shigeki Iwama (Chairman & Managing Director), Vinay Mittal (CFO), and several other directors, including Noboru Sube, Kaori Osakada, and independent directors like Manoj Arora and Anuradha Dutt, who oversee the company's operations and strategy.

The management team of Honda India includes the following key members:<BR><BR>1. **Shigeki Iwama** - Chairman & Managing Director (CMD) & CEO<BR>2. **Vinay Mittal** - Whole Time Director & Chief Financial Officer (CFO)<BR>3. **Noboru Sube** - Whole-time Director<BR>4. **Kaori Osakada** - Director<BR>5. **Sunita Ganjoo** - Company Secretary & Compliance Officer<BR>6. **Manoj Arora** - Non-Executive & Independent Director<BR>7. **Alka Marezban Bharucha** - Non-Executive & Independent Director<BR>8. **Ravi Prakash Mehrotra** - Non-Executive & Independent Director<BR>9. **Anuradha Dutt** - Independent Director<BR><BR>This team is responsible for overseeing the operations and strategic direction of Honda India.

View full answer

Who are the peers of the Honda India?

11-Jun-2026

Honda India's peers include Windsor Machines, JNK, HLE Glascoat, and others, with varying management and growth risks. In terms of returns, Honda India has a 1-year return of -25.95%, better than Pennar Industrie but worse than JNK's 28.68%.

Peers: The peers of Honda India are Windsor Machines, JNK, HLE Glascoat, Kilburn Engg., Pennar Industrie, HMT, Walchan. Inds., Aimtron, and Vinyas Innovativ.<BR><BR>Quality Snapshot: Excellent management risk is observed at JNK, HLE Glascoat, Kilburn Engg., and Honda India, while Average management risk is found at Windsor Machines, Pennar Industrie, Aimtron, Vinyas Innovativ, and Thejo Engg. Below Average management risk is noted at Walchan. Inds. and HMT. Growth is Excellent at Aimtron and Vinyas Innovativ, while Good growth is seen at Kilburn Engg. and Pennar Industrie. Below Average growth is present at Windsor Machines, JNK, HLE Glascoat, Honda India, and Walchan. Inds. <BR><BR>Return Snapshot: JNK has the highest 1-year return at 28.68%, while Pennar Industrie has the lowest at -37.86%. Honda India’s 1-year return of -25.95% is better than Pennar Industrie but worse than JNK. Additionally, HLE Glascoat, Kilburn Engg., Pennar Industrie, and HMT all have negative six-month returns.

View full answer

How has been the historical performance of Honda India?

13-Nov-2025

Honda India's historical performance shows a decline in net sales and profits from March 2023 to March 2025, with net sales dropping from 1,246.29 Cr to 794.23 Cr, while operating profit fell from 135.09 Cr to 87.68 Cr. Despite these declines, the company increased its reserves and total assets, indicating some financial stability.

Answer:<BR>The historical performance of Honda India shows a fluctuating trend in net sales and profits over the years, with a notable decline in recent periods.<BR><BR>Breakdown:<BR>Honda India's net sales peaked at 1,246.29 Cr in March 2023 but fell to 794.23 Cr by March 2025. This decline is accompanied by a decrease in total operating income, which also dropped from 1,246.29 Cr in March 2023 to 794.23 Cr in March 2025. The raw material costs have similarly decreased from 653.19 Cr in March 2023 to 366.92 Cr in March 2025, reflecting a reduction in production costs. Operating profit, excluding other income, showed a decline from 135.09 Cr in March 2023 to 87.68 Cr in March 2025, while profit before tax decreased from 115.40 Cr to 107.70 Cr in the same period. Profit after tax followed a similar trend, declining from 85.09 Cr in March 2023 to 79.94 Cr in March 2025. Despite these declines, the company's reserves increased from 726.60 Cr in March 2023 to 853.39 Cr in March 2025, indicating a strengthening of the balance sheet. Total assets rose from 915.57 Cr in March 2023 to 1,034.26 Cr in March 2025, while total liabilities also increased from 915.57 Cr to 1,034.26 Cr, reflecting a consistent growth in the company's financial structure. However, cash flow from operating activities decreased significantly from 157.00 Cr in March 2023 to 22.00 Cr in March 2025, contributing to a net cash outflow of 75.00 Cr by March 2025. Overall, Honda India has experienced a challenging financial landscape with declining sales and profits, yet it has managed to bolster its reserves and total assets.

View full answer

Is Honda India technically bullish or bearish?

15-Oct-2025

As of October 14, 2025, the technical trend is mildly bearish, supported by bearish MACD readings and Bollinger Bands on weekly and monthly time frames, despite some mixed signals from Dow Theory and daily moving averages.

As of 14 October 2025, the technical trend has changed from sideways to mildly bearish. The current stance is mildly bearish, driven by the weekly and monthly MACD readings, both indicating a bearish trend. Bollinger Bands also confirm a bearish outlook on both weekly and monthly time frames. The KST is mildly bearish on the weekly and bearish on the monthly, while the Dow Theory presents a mixed view with a mildly bearish weekly and a mildly bullish monthly. Despite the daily moving averages showing a mildly bullish signal, the overall indicators suggest a bearish sentiment, particularly in the context of the recent price decline and negative returns compared to the Sensex across multiple time frames.

View full answer

Is Honda India overvalued or undervalued?

22-Aug-2025

As of August 21, 2025, Honda India is considered overvalued with a valuation grade of "expensive," reflected in its high PE ratio of 41.71 and a year-to-date return of -16.89%, despite a recent stock performance uptick.

As of 21 August 2025, Honda India's valuation grade has moved from very expensive to expensive, indicating a slight improvement in perceived value but still reflecting a high valuation. The company is currently considered overvalued. Key ratios include a PE ratio of 41.71, an EV to EBITDA of 31.84, and a Price to Book Value of 3.73, all of which are significantly higher than industry norms.<BR><BR>In comparison with peers, Honda India’s PE ratio of 41.71 is notably higher than that of Apar Industries, which stands at 37.58, while Siemens Energy has a staggering PE of 119.76, illustrating the varying valuations within the sector. Despite a recent uptick in stock performance, with a 1-week return of 5.11% compared to the Sensex's 1.74%, the overall trend over the past year shows Honda India lagging with a return of -16.89% against the Sensex's 1.35%. This further supports the conclusion that Honda India remains overvalued in its current market context.

View full answer

Has Honda India declared dividend?

14-Aug-2025

Yes, Honda India Power Products Ltd has declared a dividend of 215%, amounting to ₹10 per share, with an ex-date of September 18, 2025. The company has shown varying total returns over different periods, with strong performance in the long term despite short-term fluctuations.

Honda India Power Products Ltd has declared a dividend.<BR><BR>Dividend Details:<BR>- Percentage announced: 215%<BR>- Amount per share: 10<BR>- Ex-date: 18 Sep 25<BR><BR>Dividend Yield: 0.99%.<BR><BR>Total Returns by Period:<BR>Over the 3-month period, the price return was 27.34%, the dividend return was 5.15%, resulting in a total return of 32.49%.<BR><BR>In the 6-month period, the price return was 32.08%, the dividend return was 6.05%, leading to a total return of 38.13%.<BR><BR>For the 1-year period, the price return was -20.07%, the dividend return was 4.10%, resulting in a total return of -15.97%.<BR><BR>During the 2-year period, the price return was 24.33%, the dividend return was 5.70%, culminating in a total return of 30.03%.<BR><BR>In the 3-year period, the price return was 97.42%, the dividend return was 12.31%, leading to a total return of 109.73%.<BR><BR>Over the 4-year period, the price return was 130.62%, the dividend return was 15.87%, resulting in a total return of 146.49%.<BR><BR>In the 5-year period, the price return was 176.71%, the dividend return was 20.11%, culminating in a total return of 196.82%.<BR><BR>Overall, Honda India Power Products Ltd has declared a significant dividend and has shown varying total returns over different periods, with particularly strong performance in the longer terms, indicating a positive trend in returns despite some fluctuations in the shorter term.

View full answer

Who are the top shareholders of the Honda India?

06-Jun-2025

The top shareholders of Honda India include Honda Motor Co. Ltd. with 66.67%, Nippon Life India Trustee Ltd. at 8.82%, mutual funds with 18.17%, foreign institutional investors at 1.37%, and individual investors holding 11.94%.

The top shareholders of Honda India are primarily dominated by its promoters. The largest shareholder is Honda Motor Co. Ltd., which holds 66.67% of the company. Additionally, Nippon Life India Trustee Ltd. is the highest public shareholder with an 8.82% stake. Mutual funds collectively hold 18.17% through three schemes, while foreign institutional investors (FIIs) have a smaller share of 1.37%, held by 51 different entities. Individual investors account for 11.94% of the holdings.

View full answer
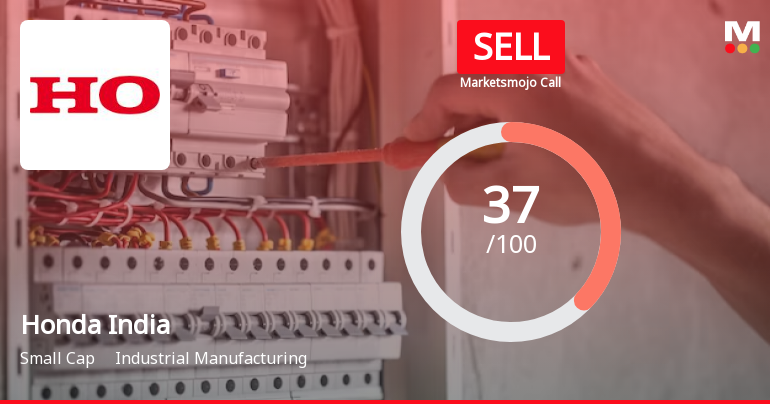
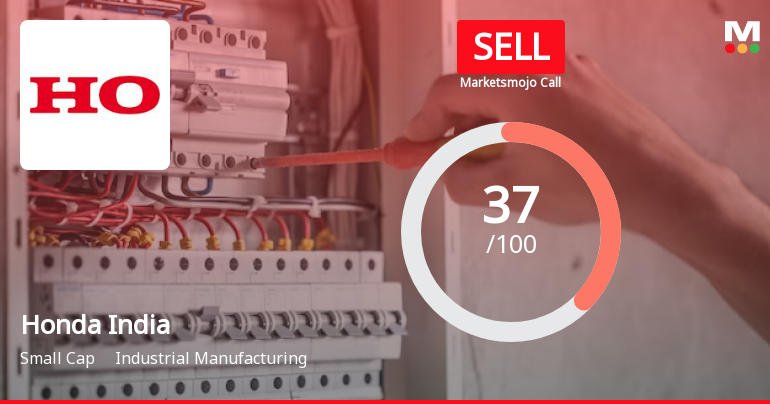
iScoreScore
Click here to find our call on this stock
Strong Sell
Sell
Hold
Buy
Strong Buy

Dashboard

1

Poor long term growth as Net Sales has grown by an annual rate of -3.81% and Operating profit at -5.02% over the last 5 years

 
2

Flat results in Jun 26

3

Below par performance in long term as well as near term

stock-summaryMojo Parameters

Mojo Parameters

Loading Valuation Snapshot...

Stock DNA

stock-summary
Industry

Industrial Manufacturing

stock-summary
Market cap

INR 2,143 Cr (Small Cap)

stock-summary
P/E

29.00

stock-summary
Industry P/E

53

stock-summary
Dividend Yield

5.96%

stock-summary
Debt Equity

-0.10

stock-summary
Return on Equity

9.10%

stock-summary
Price to Book

2.65

Revenue and Profits:
Net Sales:
189 Cr
(Quarterly Results - Jun 2026)
Net Profit:
11 Cr
stock-summaryTotal Returns
Total Returns (Price + Dividend) stock-summary
Dividend Yield (5.96%)
TimePeriod
Price Return
Dividend Return
Total Return
3 Months
-7.94%
0.99%
-6.95%
6 Months
-3.97%
1.21%
-2.76%
1 Year
-27.57%
5.31%
-22.26%
2 Years
-47.93%
4.81%
-43.12%
3 Years
-3.79%
7.56%
3.77%
4 Years
32.97%
14.01%
46.98%
5 Years
75.39%
17.67%
93.06%

Latest dividend: 3.5 per share ex-dividend date: Feb-18-2026

Risk Adjusted Returns v/s stock-summary
Returns Beta
Icon
Beta has not been calculated since enough price history is not available
stock-summaryNews & Corporate Actions

News

Announcements stock-summary

Honda Siel Power Products Limited - Other General Purpose

03-Dec-2019 | Source : NSE

Honda Siel Power Products Limited has submitted to the Exchange a copy of Disclosure of Related Party Transactions under Regulation 23(9) of SEBI (Listing Obligations and Disclosure Requirements) Regulations, 2015 for the half year ended September 30, 2019.

Shareholders meeting

05-Sep-2019 | Source : NSE

Honda Siel Power Products Limited has informed the Exchange with copy of minutes of Annual General Meeting held on August 07, 2019

Shareholders meeting

08-Aug-2019 | Source : NSE

Honda Siel Power Products Limited has submitted the Exchange a copy Srutinizers report of Annual General Meeting held on August 07, 2019

Corporate Actions stock-summary

stock-summary
BOARD MEETING

No Upcoming Board Meetings

stock-summary
DIVIDEND

Honda India Power Products Ltd has declared 230% dividend, ex-date: 19 Aug 26

stock-summary
SPLITS

No Splits history available

stock-summary
BONUS

No Bonus history available

stock-summary
RIGHTS

No Rights history available

stock-summaryKey Factors

Quality key factors stock-summary

Factor
Value
Sales Growth (5y)
-3.81%
EBIT Growth (5y)
-5.02%
EBIT to Interest (avg)
77.53
Debt to EBITDA (avg)
Net Debt is too low
Net Debt to Equity (avg)
-0.10
Sales to Capital Employed (avg)
1.38
Tax Ratio
25.16%
Dividend Payout Ratio
27.27%
Pledged Shares
0
Institutional Holding
19.25%
ROCE (avg)
22.73%
ROE (avg)
10.67%

Valuation key factors

Factor
Value
P/E Ratio
29
Industry P/E
53
Price to Book Value
2.66
EV to EBIT
32.53
EV to EBITDA
23.48
EV to Capital Employed
2.84
EV to Sales
2.29
PEG Ratio
NA
Dividend Yield
5.93%
ROCE (Latest)
8.07%
ROE (Latest)
9.10%

Technicals key factors

Indicator
Weekly
Monthly
MACD
Bearish
Bearish
RSI
No Signal
No Signal
Bollinger Bands
Mildly Bearish
Mildly Bearish
Moving Averages
Bearish (Daily)
KST
Bearish
Bearish
Dow Theory
No Trend
No Trend
OBV
No Trend
No Trend
stock-summary Technical Indicator Scale: Bearish, Mildly Bearish, Sideways, Mildly Bullish, Bullish  Turned 
stock-summaryShareholding
Shareholding Snapshot : Jun 2026stock-summary
Shareholding Compare (%holding) stock-summary
Majority shareholders

Promoters

Pledged Promoter Holdings

None

Mutual Funds

Held by 4 Schemes (18.26%)

FIIs

Held by 45 FIIs (0.98%)

Promoter with highest holding

Honda Motor Co. Ltd (66.67%)

Highest Public shareholder

Nippon Life India Trustee Ltd (8.86%)

Individual Investors Holdings

12.25%

stock-summaryFinancial
[
  {
    "link": "quarterly",
    "btn_text": "All Quarterly Results",
    "header": "Quarterly Results Snapshot (Standalone) - Jun'26 - YoY",
    "rhs": [
      {
        "prefix": "Net Sales ",
        "suffix": "YoY Growth in quarter ended Jun 2026 is 22.17% vs 7.45% in Jun 2025",
        "dir": 1
      },
      {
        "prefix": "Standalone Net Profit ",
        "suffix": "YoY Growth in quarter ended Jun 2026 is 17.09% vs -41.30% in Jun 2025",
        "dir": 1
      }
    ],
    "table": {
      "header": [
        "Jun'26",
        "Jun'25",
        "Change(%)"
      ],
      "body": [
        {
          "field": "Net Sales",
          "val1": "189.25",
          "val2": "154.91",
          "chgp": "22.17%",
          "chgp_class": "positive"
        },
        {
          "field": "Operating Profit (PBDIT) excl Other Income",
          "val1": "14.43",
          "val2": "8.44",
          "chgp": "70.97%",
          "chgp_class": "positive"
        },
        {
          "field": "Interest",
          "val1": "0.06",
          "val2": "0.04",
          "chgp": "50.00%",
          "chgp_class": "negative"
        },
        {
          "field": "Exceptional Items",
          "val1": "0.00",
          "val2": "0.00",
          "chgp": "",
          "chgp_class": "neutral"
        },
        {
          "field": "Standalone Net Profit",
          "val1": "11.10",
          "val2": "9.48",
          "chgp": "17.09%",
          "chgp_class": "positive"
        },
        {
          "field": "Operating Profit Margin (Excl OI)",
          "val1": "7.62%",
          "val2": "5.45%",
          "chgp": "2.17%",
          "chgp_class": "positive"
        }
      ]
    }
  },
  {
    "link": "half-yearly",
    "btn_text": "All Half Yearly Results",
    "header": "Half Yearly Results Snapshot (Standalone) - Sep'25",
    "rhs": [
      {
        "prefix": "Net Sales ",
        "suffix": " Growth in half year ended Sep 2025 is 2.85% vs -35.02% in Sep 2024",
        "dir": 1
      },
      {
        "prefix": "Standalone Net Profit ",
        "suffix": " Growth in half year ended Sep 2025 is -16.36% vs -48.66% in Sep 2024",
        "dir": 1
      }
    ],
    "table": {
      "header": [
        "Sep'25",
        "Sep'24",
        "Change(%)"
      ],
      "body": [
        {
          "field": "Net Sales",
          "val1": "330.52",
          "val2": "321.37",
          "chgp": "2.85%",
          "chgp_class": "positive"
        },
        {
          "field": "Operating Profit (PBDIT) excl Other Income",
          "val1": "19.77",
          "val2": "23.48",
          "chgp": "-15.80%",
          "chgp_class": "negative"
        },
        {
          "field": "Interest",
          "val1": "0.07",
          "val2": "0.09",
          "chgp": "-22.22%",
          "chgp_class": "positive"
        },
        {
          "field": "Exceptional Items",
          "val1": "0.00",
          "val2": "0.00",
          "chgp": "",
          "chgp_class": "neutral"
        },
        {
          "field": "Standalone Net Profit",
          "val1": "20.65",
          "val2": "24.69",
          "chgp": "-16.36%",
          "chgp_class": "negative"
        },
        {
          "field": "Operating Profit Margin (Excl OI)",
          "val1": "5.98%",
          "val2": "7.31%",
          "chgp": "-1.33%",
          "chgp_class": "negative"
        }
      ]
    }
  },
  {
    "link": "nine-monthly",
    "btn_text": "All Nine Monthly Results",
    "header": "Nine Monthly Results Snapshot (Standalone) - Dec'25",
    "rhs": [
      {
        "prefix": "Net Sales ",
        "suffix": "YoY Growth in nine months ended Dec 2025 is 14.34% vs -30.66% in Dec 2024",
        "dir": 1
      },
      {
        "prefix": "Standalone Net Profit ",
        "suffix": "YoY Growth in nine months ended Dec 2025 is -14.76% vs -42.70% in Dec 2024",
        "dir": 1
      }
    ],
    "table": {
      "header": [
        "Dec'25",
        "Dec'24",
        "Change(%)"
      ],
      "body": [
        {
          "field": "Net Sales",
          "val1": "600.92",
          "val2": "525.55",
          "chgp": "14.34%",
          "chgp_class": "positive"
        },
        {
          "field": "Operating Profit (PBDIT) excl Other Income",
          "val1": "51.76",
          "val2": "44.28",
          "chgp": "16.89%",
          "chgp_class": "positive"
        },
        {
          "field": "Interest",
          "val1": "0.11",
          "val2": "0.14",
          "chgp": "-21.43%",
          "chgp_class": "positive"
        },
        {
          "field": "Exceptional Items",
          "val1": "-11.84",
          "val2": "0.00",
          "chgp": "",
          "chgp_class": "neutral"
        },
        {
          "field": "Standalone Net Profit",
          "val1": "37.32",
          "val2": "43.78",
          "chgp": "-14.76%",
          "chgp_class": "negative"
        },
        {
          "field": "Operating Profit Margin (Excl OI)",
          "val1": "8.61%",
          "val2": "8.43%",
          "chgp": "0.18%",
          "chgp_class": "positive"
        }
      ]
    }
  },
  {
    "link": "annual",
    "btn_text": "All Annual Results",
    "header": "Annual Results Snapshot (Standalone) - Mar'26",
    "rhs": [
      {
        "prefix": "Net Sales ",
        "suffix": "YoY Growth in year ended Mar 2026 is 8.97% vs -19.70% in Mar 2025",
        "dir": 1
      },
      {
        "prefix": "Standalone Net Profit ",
        "suffix": "YoY Growth in year ended Mar 2026 is -19.64% vs -13.31% in Mar 2025",
        "dir": -1
      }
    ],
    "table": {
      "header": [
        "Mar'26",
        "Mar'25",
        "Change(%)"
      ],
      "body": [
        {
          "field": "Net Sales",
          "val1": "865.45",
          "val2": "794.23",
          "chgp": "8.97%",
          "chgp_class": "positive"
        },
        {
          "field": "Operating Profit (PBDIT) excl Other Income",
          "val1": "81.72",
          "val2": "87.68",
          "chgp": "-6.80%",
          "chgp_class": "negative"
        },
        {
          "field": "Interest",
          "val1": "0.16",
          "val2": "0.46",
          "chgp": "-65.22%",
          "chgp_class": "positive"
        },
        {
          "field": "Exceptional Items",
          "val1": "-9.99",
          "val2": "0.00",
          "chgp": "",
          "chgp_class": "neutral"
        },
        {
          "field": "Standalone Net Profit",
          "val1": "64.24",
          "val2": "79.94",
          "chgp": "-19.64%",
          "chgp_class": "negative"
        },
        {
          "field": "Operating Profit Margin (Excl OI)",
          "val1": "9.44%",
          "val2": "11.04%",
          "chgp": "-1.60%",
          "chgp_class": "negative"
        }
      ]
    }
  }
]

Quarterly Results Snapshot (Standalone) - Jun'26 - YoYstock-summary

Jun'26
Jun'25
Change(%)
Net Sales
189.25
154.91
22.17%
Operating Profit (PBDIT) excl Other Income
14.43
8.44
70.97%
Interest
0.06
0.04
50.00%
Exceptional Items
0.00
0.00
Standalone Net Profit
11.10
9.48
17.09%
Operating Profit Margin (Excl OI)
7.62%
5.45%
2.17%
Values in Rs Cr.
Direction Arrows
Net Sales

YoY Growth in quarter ended Jun 2026 is 22.17% vs 7.45% in Jun 2025

Direction Arrows
Standalone Net Profit

YoY Growth in quarter ended Jun 2026 is 17.09% vs -41.30% in Jun 2025

Half Yearly Results Snapshot (Standalone) - Sep'25stock-summary

Sep'25
Sep'24
Change(%)
Net Sales
330.52
321.37
2.85%
Operating Profit (PBDIT) excl Other Income
19.77
23.48
-15.80%
Interest
0.07
0.09
-22.22%
Exceptional Items
0.00
0.00
Standalone Net Profit
20.65
24.69
-16.36%
Operating Profit Margin (Excl OI)
5.98%
7.31%
-1.33%
Values in Rs Cr.
Direction Arrows
Net Sales

Growth in half year ended Sep 2025 is 2.85% vs -35.02% in Sep 2024

Direction Arrows
Standalone Net Profit

Growth in half year ended Sep 2025 is -16.36% vs -48.66% in Sep 2024

Nine Monthly Results Snapshot (Standalone) - Dec'25stock-summary

Dec'25
Dec'24
Change(%)
Net Sales
600.92
525.55
14.34%
Operating Profit (PBDIT) excl Other Income
51.76
44.28
16.89%
Interest
0.11
0.14
-21.43%
Exceptional Items
-11.84
0.00
Standalone Net Profit
37.32
43.78
-14.76%
Operating Profit Margin (Excl OI)
8.61%
8.43%
0.18%
Values in Rs Cr.
Direction Arrows
Net Sales

YoY Growth in nine months ended Dec 2025 is 14.34% vs -30.66% in Dec 2024

Direction Arrows
Standalone Net Profit

YoY Growth in nine months ended Dec 2025 is -14.76% vs -42.70% in Dec 2024

Annual Results Snapshot (Standalone) - Mar'26stock-summary

Mar'26
Mar'25
Change(%)
Net Sales
865.45
794.23
8.97%
Operating Profit (PBDIT) excl Other Income
81.72
87.68
-6.80%
Interest
0.16
0.46
-65.22%
Exceptional Items
-9.99
0.00
Standalone Net Profit
64.24
79.94
-19.64%
Operating Profit Margin (Excl OI)
9.44%
11.04%
-1.60%
Values in Rs Cr.
Direction Arrows
Net Sales

YoY Growth in year ended Mar 2026 is 8.97% vs -19.70% in Mar 2025

Direction Arrows
Standalone Net Profit

YoY Growth in year ended Mar 2026 is -19.64% vs -13.31% in Mar 2025

stock-summaryCompany CV
About Honda India Power Products Ltd stock-summary
stock-summary
Honda India Power Products Ltd
Small Cap
Industrial Manufacturing
Honda India Power Products Limited (Formerly known as Honda Siel Power Products Limited) was incorporated in September, 1985 as a Joint Venture. Earlier it was called Shriram Honda Power, promoted by Honda Motor Co, Japan, and Shriram Industrial Enterprises. In 1998-99, it changed its name to Honda Siel Power Products Limited and thereafter has changed the name to Honda India Power Products Limited on May 24, 2020. Honda Motor, Japan, holds a 66.67% stake in the company.
Company Coordinates stock-summary
Company Details
409 DLF Tower B, Jasola Commercial Complex New Delhi New Delhi : 110025
Registrar Details
MAS Services Ltd, T-34 , 2nd Floor, Okhla Industrial Area, Phase - II, New Delhi